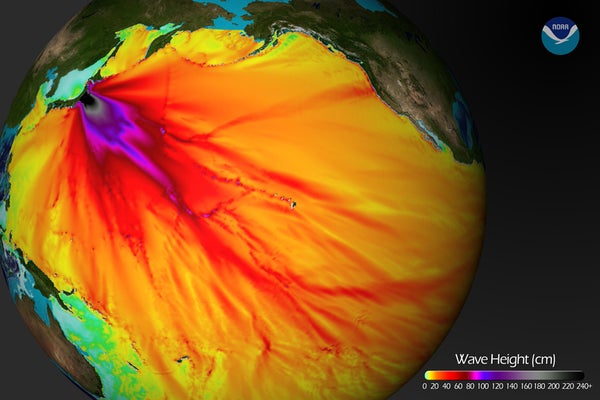
NOAA map predicts tsunami wave heights around the Pacific Rim
This graphic shows the National Oceanic and Atmospheric Administration's predictions of the maximum heights of tsunami waves caused by the March 11 earthquake near Sendai, Japan.
NOAA Center for Tsunami Research
Join Our Community of Science Lovers!
On supporting science journalism
If you're enjoying this article, consider supporting our award-winning journalism by subscribing. By purchasing a subscription you are helping to ensure the future of impactful stories about the discoveries and ideas shaping our world today.
This graphic shows the National Oceanic and Atmospheric Administration's predictions of the maximum heights of tsunami waves caused by the March 11 earthquake near Sendai, Japan. The wave heights will decrease as the waves cross the deep Pacific Basin but rise again as they approach shorelines, although they won't be as high as they were around Japan. The map shows waves of 30 to 70 centimeters (1.0 feet to 2.3 feet) are predicted to hit New Zealand, the South Pacific islands, Hawaii and the western coast of North America.
If you enjoyed this article, I’d like to ask for your support. Scientific American has served as an advocate for science and industry for 180 years, and right now may be the most critical moment in that two-century history.
I’ve been a Scientific American subscriber since I was 12 years old, and it helped shape the way I look at the world. SciAm always educates and delights me, and inspires a sense of awe for our vast, beautiful universe. I hope it does that for you, too.
If you subscribe to Scientific American, you help ensure that our coverage is centered on meaningful research and discovery; that we have the resources to report on the decisions that threaten labs across the U.S.; and that we support both budding and working scientists at a time when the value of science itself too often goes unrecognized.