
Key Concepts
Mathematics
Probability
Statistics
Introduction
On supporting science journalism
If you're enjoying this article, consider supporting our award-winning journalism by subscribing. By purchasing a subscription you are helping to ensure the future of impactful stories about the discoveries and ideas shaping our world today.
Have you ever noticed how sometimes what seems logical turns out to be proved false with a little math? For instance, how many people do you think it would take to survey, on average, to find two people who share the same birthday? Due to probability, sometimes an event is more likely to occur than we believe it to. In this case, if you survey a random group of just 23 people there is actually about a 50–50 chance that two of them will have the same birthday. This is known as the birthday paradox. Don't believe it's true? You can test it and see mathematical probability in action!
Background
The birthday paradox, also known as the birthday problem, states that in a random group of 23 people, there is about a 50 percent chance that two people have the same birthday. Is this really true? There are multiple reasons why this seems like a paradox. One is that when in a room with 22 other people, if a person compares his or her birthday with the birthdays of the other people it would make for only 22 comparisons—only 22 chances for people to share the same birthday.
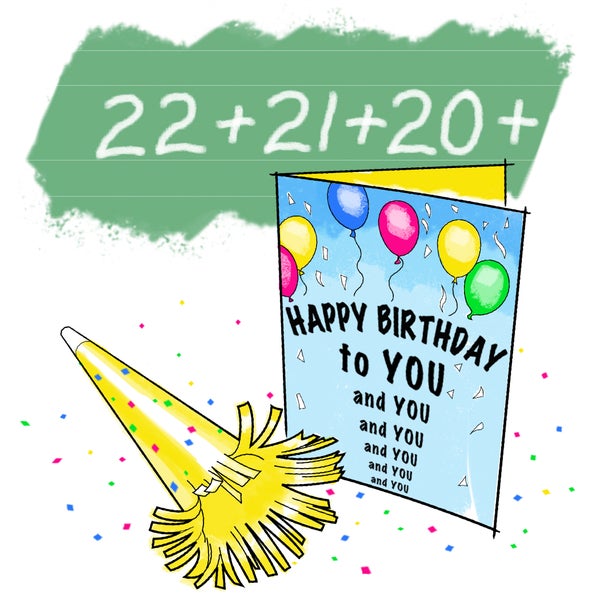
But when all 23 birthdays are compared against each other, it makes for much more than 22 comparisons. How much more? Well, the first person has 22 comparisons to make, but the second person was already compared to the first person, so there are only 21 comparisons to make. The third person then has 20 comparisons, the fourth person has 19 and so on. If you add up all possible comparisons (22 + 21 + 20 + 19 + … +1) the sum is 253 comparisons, or combinations. Consequently, each group of 23 people involves 253 comparisons, or 253 chances for matching birthdays.
Materials
Groups of 23 or more people (10 to 12 such groups) or a source with random birthdays (see Preparation below for tips)
Paper and pen or pencil
Calculator (optional)
Preparation
Collect birthdays for random groups of 23 or more people. Ideally you should get 10 to 12 groups of 23 or more people so you have enough different groups to compare. (You don't need the year for the birthdays, just the month and day.)
Tip: Here are a few ways that you can find a number of randomly grouped people: Ask school teachers to pass a list around each of their classes to collect the birthdays for students in the class (most schools have around 25 students in a class); use the birthdays of players on major league baseball teams (this information can easily be found on the Internet); or use the birthdays of other random people using online sources.
Procedure
For each group of 23 or more birthdays that you collected, sort through them to see if there are any birthday matches in each group.
How many of your groups have two or more people with the same birthday? Based on the birthday paradox, how many groups would you expect to find that have two people with the same birthday? Does the birthday paradox hold true?
Extra: In this activity you used a group of 23 or more people, but you could try it using bigger groups.
If you use a group of 366 people—the greatest number of days a year can have—the odds that two people have the same birthday are 100 percent (excluding February 29 leap year birthdays), but what do you think the odds are in a group of 60 or 75 people?
Extra: Rolling dice is a great way to investigate probability. You could try rolling three 10-sided dice and five six-sided dice 100 times each and record the results of each roll. Calculate the mathematical probability of getting a sum higher than 18 for each combination of dice when rolling them 100 times. (This Web site can teach you how to calculate probability: Probability Central from Oracle ThinkQuest.)
Which combination has a higher mathematical probability, and was this true when you rolled them?
Observations and results
Did about 50 percent of the groups of 23 or more people include at least two people with the same birthdays?
When comparing probabilities with birthdays, it can be easier to look at the probability that people do not share a birthday. A person's birthday is one out of 365 possibilities (excluding February 29 birthdays). The probability that a person does not have the same birthday as another person is 364 divided by 365 because there are 364 days that are not a person's birthday. This means that any two people have a 364/365, or 99.726027 percent, chance of not matching birthdays.
As mentioned before, in a group of 23 people, there are 253 comparisons, or combinations, that can be made. So, we're not looking at just one comparison, but at 253 comparisons. Every one of the 253 combinations has the same odds, 99.726027 percent, of not being a match. If you multiply 99.726027 percent by 99.726027 253 times, or calculate (364/365)253, you'll find there's a 49.952 percent chance that all 253 comparisons contain no matches. Consequently, the odds that there is a birthday match in those 253 comparisons is 1 – 49.952 percent = 50.048 percent, or just over half! The more trials you run, the closer the actual probability should approach 50 percent.
More to Explore
"Understanding the Birthday Paradox" from BetterExplained
"Probability Central" from Oracle ThinkQuest
"Combinations and Permutations" from MathIsFun
"The Birthday Paradox" from Science Buddies
This activity brought to you in partnership with Science Buddies