
All basketball fans know about the hot hand: pass to a teammate on a scoring streak since her or his chances of making the next basket are higher than usual. This venerated principle was discredited in 1985 by Thomas Gilovich, Robert Vallone, and Amos Tversky. Their statistical study of field goal data from the Philadelphia 76ers, free throw data from the Boston Celtics, and a controlled 100-shot-per-player experiment on Cornell University varsity and junior varsity basketball players seemed to prove that such scoring streaks are not out of the ordinary. Although fans think that their players have hot hands, the streaks can be explained by mere chance.
This game-changing news received a lukewarm reception from professional sports. Red Auerbach, president of the Boston Celtics when the hot-hand study was released, famously gave his views on Tversky: ‘‘Who is this guy? So, he makes a study. I couldn’t care less.’’
Academics, however, seemed to be fascinated by the finding. The 1985 study launched an avalanche of scholarly literature, and the hot-hand question has propelled investigations about the conflict between the instincts of professionals and the cold hard facts of science. In his bestselling book The Undoing Project, Michael Lewis tells the story of Amos Tversky and his lifelong collaborator, Nobel laureate Daniel Kahneman. Their research prompted the study of behavioral economics and has transformed our understanding of the flaws in human decision-making. Lewis writes, ‘‘Tversky had the clear idea of how people misperceived randomness... People had incredible ability to see meaning in these patterns where none existed.’’
On supporting science journalism
If you're enjoying this article, consider supporting our award-winning journalism by subscribing. By purchasing a subscription you are helping to ensure the future of impactful stories about the discoveries and ideas shaping our world today.
Early in their careers, Amos Tversky and Daniel Kahneman considered the human tendency to draw conclusions based on a few observations, which they called the ‘‘law of small numbers’’. This is a playful allusion to the law of large numbers, which provides guidance about when accurate inference can be drawn from a large data set. There is no general rule about how to draw inference from a small data set, and it can be difficult to notice that there is a problem.
A Basic Statistical Formulation of a Hot Hand
There are many ways to represent the notion of ‘‘hot hand’’ in a statistical experiment. In this study as in the original study, a hot hand is an abnormally high probability of making a shot, given a string of hits.
This formulation neglects some of the details of the game. Some shots are harder to make than others, and defensive maneuvers by the opposition may put a high-performing player in a disadvantageous spot. Still, it is interesting to look at the results of this simple experiment before attempting to add realism.
There are also many ways that one might define the term ‘‘abnormally high.’’ Again we follow the original hot-hand study, which relied on a difference of conditional probabilities: the probability of making a shot given a string of hits minus the probability of making a shot given an equally long string of misses. If the observed difference is large relative to the typical difference corresponding to a random string of the same length and the same number of hits, the observation corresponds to a hot hand.
A ‘‘Law of Small Numbers’’ Error in the Original Hot-Hand Study, and a Correction
In 2015, statisticians Josh Miller and Adam Sanjurjo documented an error in the original hot-hand study. The error concerns the law of small numbers. To understand the mistake, consider Klay Thompson’s shooting record in the December 23, 2016, game against the Detroit Pistons. The record is represented by a string of 1’s (hits) and 0’s (misses):
1110100110000011:
Thompson took 16 shots in this game, and as it happened, he made exactly half of them. We can look at our statistical formulation of the hot hand on this string. First, we compute the empirical probability of a hit, given two previous hits. There are four instances of two hits in a row, indicated by the string 11. We know what happened after the first three instances: Thompson hit the first time and missed the second and third times. But nothing happened after the fourth instance of 11 because the game ended before he could take another shot.We call the final 11 an unrealized conditioning set, and it complicates the estimation of the conditional probabilities used in hot-hand studies.
Perhaps the best we can say is that in the game under consideration, we observed Thompson scoring one-third of the time following two hits in a row. In the other direction, given that Thompson missed twice in a row, he scored twofifths of the time. The second calculation is more straightforward because there is no unrealized conditioning set. The difference of the two conditional probabilities is 1/3 - 2/5 = -1/15.
Is this difference, -1/15; abnormally high? Perhaps for this string, which is half hits and half misses, there is a natural benchmark against which to measure ‘‘abnormal.’’ Based on the data, perhaps it is reasonable to assume that the probability of making a shot after two hits is the same as the probability of making a shot after two misses: 50 percent. Against this benchmark, the average difference in conditional probabilities is 0, which does not make -1/15 look abnormally high. This benchmark is consistent with the original hot-hand study.
However—and this is where the law of small numbers comes in—the 50-50 benchmark is the wrong choice. It would have been correct had we been dealing with infinite strings, but games don’t go on indefinitely. In practice, we deal with finite strings. Many have unrealized conditioning sets, and some have no conditioning sets at all, so the natural benchmark requires a small-sample adjustment. In a string of length 16 that is half 1’s and half 0’s, the probability of a hit following two hits is less than the probability of a hit following two misses: reversals are more probable than continuations. That is the observation of Miller and Sanjurjo, and it is consistent with the gambler’s fallacy, the impression that a reversal in fortunes is ‘‘due.’’ Taking this phenomenon into account, the expected difference in conditional probabilities is some value less than zero. This leaves open the potential for a study using the incorrect 50- 50 null hypothesis to fail to reject the null hypothesis in cases in which a correctly specified null distribution would lead to a rejection.
The no-hot-hand conclusion in the original study was based on a statistically insignificant difference between the observed data and the erroneous benchmarks. When the required adjustment was applied to the controlled 100-shot-per-player experiment on Cornell University players, Miller and Sanjurjo report that the no-hot-hand finding was reversed in several cases.
In Search of the Warriors’ Hot Hand
As noted by Miller and Sanjurjo, a permutation test of an observed string of hits and misses automatically implements the small-sample correction [2, Section 3.1]. In this test, a property of a particular string of zeros and ones is compared to the same property in random rearrangements of the entries of the string. This allows for a quantitative assessment of a property’s rarity.
Here, we use the permutation test to decide in which games Curry, Thompson, and Durant had hot hands, according to the formulation in the original study. We also investigated the hot-handedness of the Warriors, quarter by quarter.
Data
For Curry, Thompson, and Durant, we compiled a string of 1’s and 0’s representing hits and misses for each of the regular and postseason games that they played in 2016–2017. Curry played 96 games, Thompson played 95, and Durant played 77. We also compiled the strings of hits and misses for the Warrior team, quarter by quarter, leading to 396 = 99 x 4 quarters over the season.
Experimental Design and Test Statistics
An observation X is a game-long string of hits and misses for Curry, Thompson, or Durant or a quarter-long string of hits and misses for the Warriors. The string includes both field goals and free throws. We use a permutation test to determine whether the observation exhibits evidence of a hot hand.
For an observed string, we computed a test statistic tk; the conditional fraction of hits given k prior hits minus the conditional fraction of hits given k prior misses, where k equals 1, 2, or 3. Then we permuted the string of 0’s and 1’s representing the shot pattern 10,000 times and computed tk on each permutation.
Mathematically, the test statistic tk on a string X of length L is defined as follows:

where Hk and Mk are the numbers of substrings of k hits and k misses that are followed by shots, Xτ is the τth entry of X, and P̂ is the empirical probability. The value k is the depth of the conditioning set.
The fraction of permuted test statistics that exceed the observed test statistic is its p-value. In practice, the value of the test statistic on many of the permuted strings is the same as the value of the test statistic on the observed shot pattern. Therefore, there is some latitude in how to define the p-value. Mathematically, this latitude corresponds to the choice between
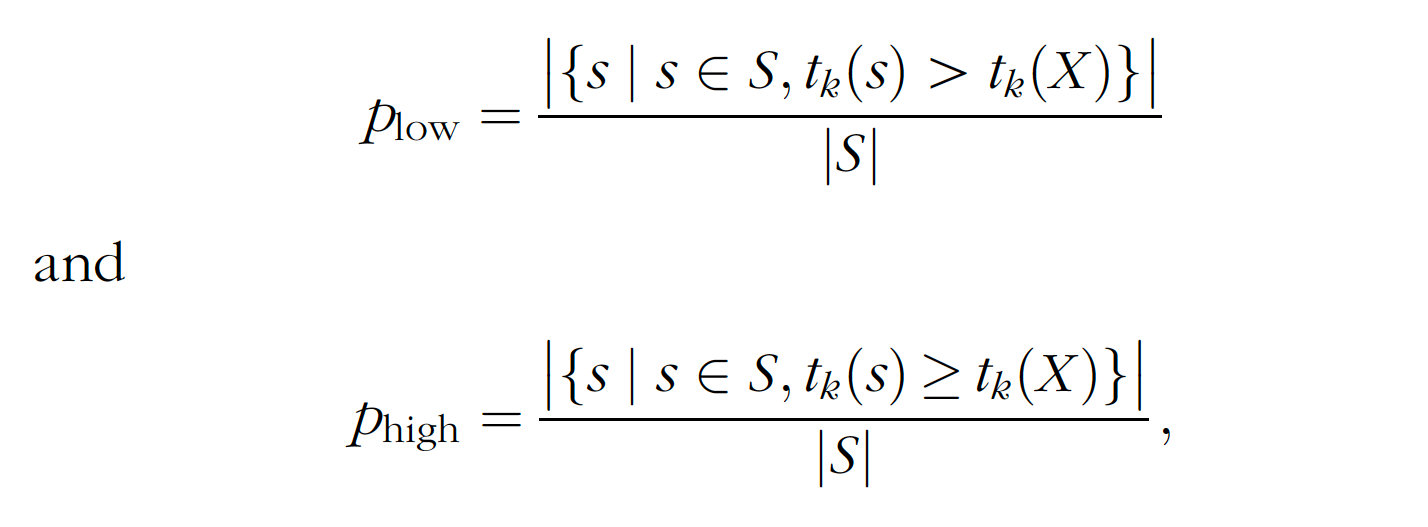
where S is the set of permuted strings. We use Plow; which makes it as easy as possible to reject the null hypothesis of ‘‘no hot hand.’’ A smaller p-value corresponds to stronger evidence of a hot hand.
Results
Statistics describing the number of shots taken and hit frequencies are displayed in Table 1.
The results presented below are mostly about t2; which shows no evidence of a hot hand. Results for t3 are qualitatively similar, although there is an indication of hotness in t1: Steph Curry’s shot strings are significant at the 5% level under a conditioning set depth of 1 in 12 out of his 96 games. Likewise, the Warriors as a team show signs of hotness in 35 out of 396 quarters using t1: However, we consider these results to constitute weak evidence in favor of the hot hand, since the apparent effect disappears under less generous testing conditions. Namely, when we use the more conventional calculation of p-values, Phigh as described in the previous section, Curry’s significant games drop to 7 out of 96, and the Warriors’ significant quarters drop to 26 out of 396. Furthermore, when we remove free-throw data, for which players tend to have higher shooting averages than during normal gameplay, Curry’s performance is statistically significant in only 5 games, and the Warriors’ in only 21 quarters. See the appendix for more details.

Table 2 displays the number of observations that are significant at the 5% level for conditioning sets of depths 1, 2, and 3 for the 2016–2017 season games played by Curry, Thompson, and Durant and for the quarters played by the Warriors. Few observations are significant at the 5% level.
In addition to the tk statistic from the original hot-hand study, we considered a number of other statistics that could potentially be indicative of a hot hand. We looked at only the left summand of tk; tk,hit: In this case, we tested a simpler definition of the hot hand: a player has a hot hand if she or he has a higher chance of making a shot following a string of successful shots. The notion of ‘‘higher chance’’ here is defined in the same way as in the test described above.
For both of our test statistics, we also considered two additional nonparametric tests. First, instead of permuting a shot string for a given game, we estimated the distribution of the test statistic by sampling 10,000 new binary strings by simulating n Bernoulli(p) trials, where p is the player’s shooting percentage for the game in question and n is the number of shots the player took. In the second test, we again simulated n Bernoulli trials; however, we let p equal the player’s season shooting percentage up to the start of the game being tested. These alternative formulations yielded the same conclusion: little or no evidence of a hot hand.
An Example
On December 5, 2016, Thompson scored 60 points against the Indiana Pacers. He made 31 of the 44 shots he took, and his record for the game is shown below:
X60: 11011110010111111001110111101110111101010101:
Does this indicate a hot hand? There are 19 instances of the string 11, and they are followed by hits in 12 of the 19 cases. There are two instances of the string 00, and they are both followed by hits. So t2 = 12/19 - 1 = -7/19.

Figure 1. t2 statistics for Thompson’s 60-point game against the Indiana Pacers on December 5, 2016. The green region represents the null hypothesis, the histogram of values of t2 corresponding to 10,000 permutations of the observed string. The blue line marks the value of t2 for the observed string, and the red critical region corresponds to the highest 5% of values of t2: the hot hand. Credit: Alon Daks
Figure 1 shows a histogram of t2 statistics based on 10,000 permutations of Thompson’s X60 string. The green region represents the null distribution, the histogram of values of t2 corresponding to 10,000 permutations of the observed string. In the appendix, we explore the bimodality of the null hypothesis as well as other irregularities in its shape. The blue line marks the value of t2 for the observed string, and the red critical region corresponds to the highest 5% of values of t2: the hot hand.
This observation is exceptional for its length, and it is exceptional for its percentage of hits, 31/44 ≈ 70%: But the difference of conditional probabilities, -7/19; has a p-value of 0.84, which is not exceptional at all.
Final Observations
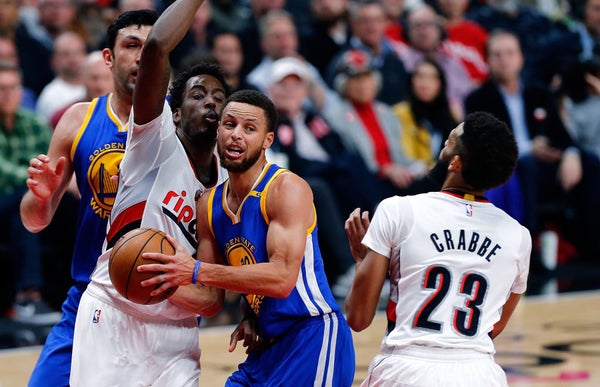
Although we examined the 2016–2017 regular season shooting records of ‘‘Splash Brothers’’ Steph Curry and Klay Thompson as well as the 2017 finals MVP Kevin Durant as statisticians, we wish to note that it is a magical experience to watch these players on the court. When they are on a roll, they seem to be the essence of hot-handedness. Yet our statistical study tells a different story. It indicates that in most of the 2016–2017 regular season games, they were not streak shooters. So our conclusion, after adjusting for the small sample effect, is similar to the original conclusion, which did not account for the small-sample effect.
Of course, this is not the end of the story. Hot hands have long fascinated sports professionals and researchers, and we are not close to consensus on the right way to think about the issue. However, every empirical hot-hand study will rely on a finite data set, so small-sample effects are bound to play a role in any correct interpretation of the results.

Amos Tversky was 59 years old when he died in 1996, five years before the Nobel Prize that he would surely have shared with Daniel Kahneman was awarded, and almost two decades before the error in his hot-hand study was found. An awesome researcher and a huge basketball fan, he would no doubt be pleased about the correction of his error if he were with us today, and he would surely be watching the spellbinding Golden State Warriors.
Appendix: Deconstructing the Null Hypothesis for t2
In this appendix we look more closely at the null hypothesis for Thompson’s 60-point game against the Indiana Pacers, depicted in Figure 1. Formula (1) expresses t2 as a difference of probabilities:
tk = tk,hit - tk,miss.

Figure 2. t2,hit and t2,miss histograms for Thompson’s 60-point game against the Indiana Pacers on December 5, 2016. Credit: Alon Daks
In Figure 2, we show histograms for tk,hit and tk,miss. The shapes of these histograms are determined entirely by the length of the string, 44, and the percentage of hits, 31/44 ≈ 70%: The spike at 1 for t2,miss occurs because missed shots are relatively rare: in many strings of length 44 with 31 hits, all consecutive pairs of misses that are followed by anything at all are followed by a hit.
For longer strings and hit probabilities in the neighborhood of 50%, the distribution of t2 and its components tends to be unimodal and symmetric. But for relatively small strings corresponding, for example, to the number of shots a top professional basketball player takes in a single game, histograms representing the null hypotheses for t2 and its components can be irregular. Consequently, finite-sample methods of the type used in this article may be preferred to asymptotic results.
Field Goals Only
The strings analyzed in this paper include both field goals and free throws. Our conclusions, however, are the same when we analyze strings of field goals.
Statistics describing attempted field goals and hit frequencies are shown in Table 3. Table 4 displays the number of observations that are significant at the 5% level for conditioning sets of depths 1, 2, and 3 for the 2016–2017 season games played by Curry, Thompson, and Durant and for the quarters played by the Warriors. Few observations are significant at the 5% level.
Reprinted with permission from the Mathematical Intelligencer.
