
Key concepts
Energy
Radioactivity
Exponential decay
Odds
Introduction
One way of creating energy is with nuclear reactors. These plants are generally safe, but occasionally there are accidents in which dangerous radioactive material escapes. You might have read about nuclear disasters, such as those at Chernobyl, Three Mile Island and Fukushima, in the news or in a history lesson. Disasters like these can take years or even decades to clean up, and make it unsafe for humans to live nearby for even longer. Why does the contamination last so long? In this (perfectly safe!) activity, you will learn about radioactive decay using coins.
Background
All matter is made of atoms. Certain types of atoms are "radioactive," meaning that they will eventually decay, or "break down" into a different type of atom. When this breakdown process occurs, the atom emits radiation. Some types of radiation surround us every day and are perfectly safe, such as radio waves and visible light; other types, such as x-rays and gamma rays, can be dangerous to humans. The types of atoms used as fuel in nuclear reactors can produce such dangerous radiation, which is why it is very important to keep the fuels safely contained. Thus it can be very dangerous when there is an explosion—or in the case of Fukushima, an earthquake—at a nuclear plant, and some of the radioactive atoms escape into the surrounding air, water or soil, causing contamination.
On supporting science journalism
If you're enjoying this article, consider supporting our award-winning journalism by subscribing. By purchasing a subscription you are helping to ensure the future of impactful stories about the discoveries and ideas shaping our world today.
The decay of radioactive materials is a random process, kind of like flipping a coin or rolling a die. At any given moment in time, there is a chance that an atom will decay, but there is also a chance it will remain the same. The rate at which radioactive materials decay is measured with something called the "half-life." The half-life describes how long, on average, it takes until one-half of the original radioactive atoms are left. The half-lives of different atoms can vary widely—some are less than a second, and others are thousands or even millions of years. In this activity, you will simulate radioactive decay by flipping coins. Coins that land tails-up "decay," and coins that land heads-up remain the same. This will allow you to learn more about the process of radioactive decay—without using any radioactive materials!
Materials
About 120 coins (this can be a mix of pennies, nickels, dimes and others)
Resealable plastic bag
Flat table top for counting coins
Paper or notepad
Pencil
Preparation
Assemble all of your materials at your workspace.
Put exactly 100 coins in the resealable bag.
Procedure
Shake the bag vigorously for a few seconds.
Open the bag and carefully dump the coins out on a tabletop. Be careful not to dump them out too quickly, or they might roll onto the floor.
Separate the coins into two piles: heads and tails. About how many coins landed heads up, and how many landed tails up? What is the ratio between the two?
Count the number of heads. Write this number down.
Put the coins that landed tails up aside. Put the coins that landed heads up back in the bag.
Shake the bag again and repeat the process. Dump the coins out, separate the coins into heads and tails, count the number of heads, write the number down, and put the heads back in the bag. About what ratio of heads/tails do you get each time?
Keep repeating this process until there are no more heads to put back in the bag, and you have set aside all 100 coins.
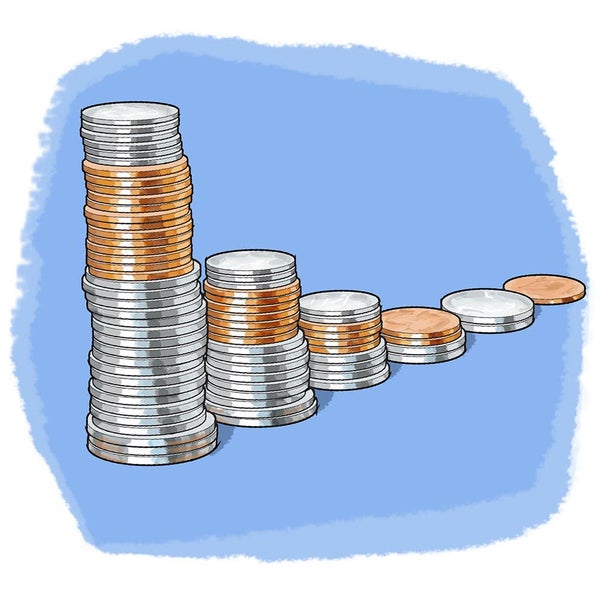
Now, look at the numbers you wrote down. Make a stack of coins the same height as each number, and line the stacks up next to each other in order (this way you are making a "graph" using stacks of coins, instead of drawing one on paper). Note that you may need to use some of your extra coins to make the stacks (for example, say you wrote down the numbers 56, 25, 13, 6, 3, and 1. That adds up to 104 coins, so even though you only used 100 coins for the experiment, you need 104 to make the graph because some coins continued to be in the "heads-up" pile numerous times). What does your "graph" look like? Does it form a straight line, or does it have a different shape? How many turns did it take you until there were no coins left?
Extra: Repeat the activity a few more times. Do you get exactly the same results each time?
Extra: Repeat the activity with different numbers of coins. What happens if you start out with 200 coins, or only 50 coins? Does the resulting graph have the same shape, or is it different?
Extra: Use a stopwatch to time how long you shake the bag to simulate materials with different half-lives, then use a ruler to space out your stacks of coins to represent time when you make your graph. For example, if you shake the bag for 10 seconds, you could place the stacks of coins 10 centimeters apart. How does this graph compare to one where you shake the bag for 20 seconds, if in both cases you start out with 100 coins? What does this mean about materials with a longer half-life?
[break]
Observations and results
You should have seen that the number of coins in the bag decreases by roughly, but not exactly, half each time you count heads and tails. For example, even if you always start out with 100 coins, that does not mean you will have exactly 50 heads and 50 tails the first time you shake the bag. You might get 56 heads and 44 or tails, or 49 heads and 51 tails. You will lose about half the coins each time, and it will probably take you about 6 turns until there are no coins left when you start out with 100 (remember that flipping a coin is a random process—so your results will not be exactly the same each time). The resulting graph does not form a straight line. Instead, it forms an exponential curve that starts off very steep, but then gradually tapers off towards zero. If you start out with more or fewer coins, the number of turns it takes you to reach zero coins will change, but the shape of the curve will remain the same.
This is why radioactive contamination is dangerous in the environment and hard to remove. Even though large amounts of the material may decay very quickly at first, smaller amounts can linger for a long time. For example, some of the contaminants in the Chernobyl disaster have half-lives of about 30 years. Imagine that you could re-do this experiment and wait 30 years until you repeated each turn. There would probably still be some coins left after more than 100 years! That is why, even though the Chernobyl disaster occurred in 1986, the area is still unsafe for humans to inhabit.
This activity was inspired by "Atomic Candy," from North Carolina State University.
More to explore
Activity: Atomic Candy, from eGFI
Radioactivity: Half-life, from GCSE Science
Releasing Particles, from Physics4Kids
Science Activities for All Ages, from Science Buddies
