
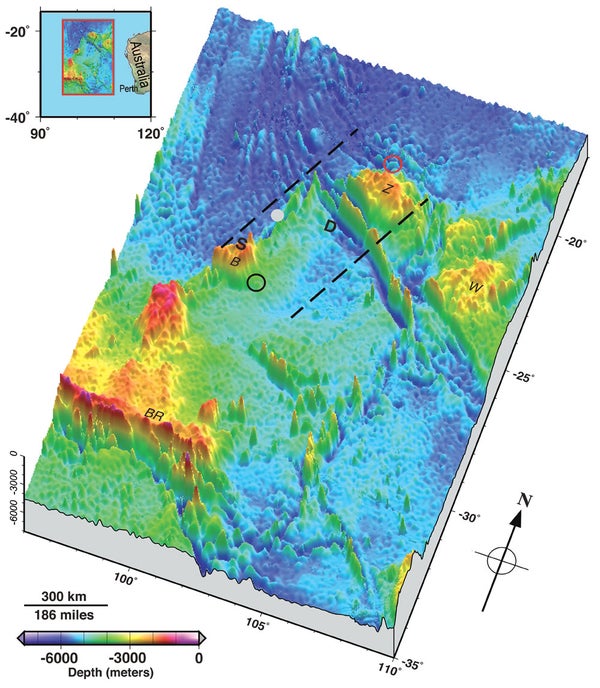
Scientists have mapped the undersea terrain that is now the focus of the search for Malaysia Airlines flight MH370 that disappeared over the Indian Ocean on March 8. Newly released satellite data appears to confirm that the plane crashed in the Indian Ocean. Walter Smith and Karen Marks of the National Oceanic and Atmospheric Administration (NOAA) Laboratory for Satellite Altimetry created the new map (published yesterday in the American Geophysical Union’s weekly newspaper) from data that had been collected by an unrelated project to chart the sea bottom. It shows rugged terrain—jagged ridges and undersea mountains several kilometers below the surface—that could challenge a submersible search, yet the chart could also serve as a valuable guide for the searchers.
Smith and Marks used satellite altimetry to create the map, a technique that takes advantage of the fact that all objects have gravity. Massive objects, such as undersea mountains, have enough gravity to slightly affect the angle and height of the sea surface above them. “We can measure sea level from space to about an inch,” Smith says. By using satellites to measure slight differences in the height and angle of the sea surface, combined with some information from ships to calibrate the satellite data, it is possible to deduce the topography of the underlying seafloor, he explains.
Smith notes that the NOAA map’s resolution is very rough; it takes a rather large mountain to create a detectable difference in the ocean surface. But he says that this kind of map must be available before the underwater vehicles that might be able to detect wreckage from the plane can be effectively deployed. “It wouldn’t be possible to make that kind of survey without first knowing what sort of terrain you were working in and how deep you had to go,” he says. Smith thinks the map will be useful for determining which types of undersea vehicles should be used to search for the plane’s seafloor debris field, because autonomous underwater vehicles can only submerge to certain depths. For example, the Bluefin-21, an underwater autonomous vehicle which has been used in the search for the missing flight, was only designed to dive to 4,500 meters; the deepest point on the new map is an estimated 7,880 meters.
On supporting science journalism
If you're enjoying this article, consider supporting our award-winning journalism by subscribing. By purchasing a subscription you are helping to ensure the future of impactful stories about the discoveries and ideas shaping our world today.
Echo soundings from ships provide much more precise measurements, Smith says, but only 5 percent of the ocean floor has been mapped that way. The new map, sketchy though it is, fills in some much-needed blanks.
On the map dashed lines approximate the search zone for the wreckage. The black circle indicates the first sonar contact reported by a Chinese vessel; the red circle indicates sonar detection by an Australian ship; the deepest point is indicated by the letter D and the shallowest by an S. The gray circle is the site of a deep-sea drilling operation.
—Geoffrey Giller