
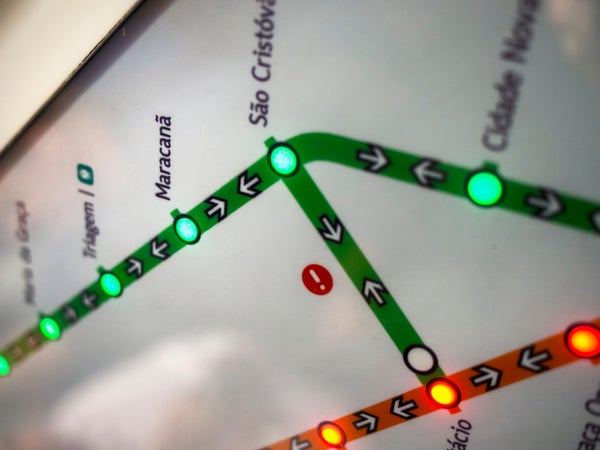
Each metro line usually has its own color on the map. For obvious reasons, these colors should be maximally different. Suppose a new metro line is built. We now explain a strategy to choose the color or several colors for the new lines, making them as different as possible from both the old ones and each other. This is illustrated by using the Moscow metro map.
•Have you seen the new terminal on the green?"
•The red is overcrowded every morning at this time."
•I live at the very end of orange, still OK with me: the escalator brings me right
into the office."
•I have to change to purple here. See you tomorrow!"
Sure, it is all about metro. The subway. The metropolitan underground railway system. Each line has its own color and each color is the name of a line. A problem arises when another line is built: the old lines must keep their colors, whereas the new line should have a color that looks maximally different from the old ones. It becomes even more complicated if there are two or more new lines in a subway. Not only must the new colors be unlike the old ones, but also they must differ from each other as much as possible.
On supporting science journalism
If you're enjoying this article, consider supporting our award-winning journalism by subscribing. By purchasing a subscription you are helping to ensure the future of impactful stories about the discoveries and ideas shaping our world today.
In this article we discuss a mathematical strategy to choose these colors. By the way, what new colors would you suggest for the real metro map in Figure 1? For our purposes this map is ideal: not only are there 14 colors in it, but also there will be several new lines built in that subway in the near future (according to [2], and the planned extensions are in Figure 6). Let us use this map to illustrate our strategy—yet the reader can apply the techniques to whatever other map he or she likes (we invite the reader to analyse the London metro map in Figure 2).
Measuring the Color Difference
To maximize color differences—here, in metro maps—we need a way to measure them and argue about colors objectively. For this we describe them as tuples of numbers by using some coordinate system (or color space). For example, the red, green, and blue (RGB) color space is well known: in it every color is encoded by its RGB components. Unfortunately, in the RGB space the Euclidean distance is not proportional to the visible distance that people perceive between colors. That is, the RGB space is not perceptually uniform—which we would like.

Figure 1. It is likely that you have already recognized the Moscow metro here.
Credit: Wikimedia (CC BY-SA 3.0)

Figure 2. The map of the London metro.
Credit: Wikimedia (CC BY-SA 4.0)
In 1931, the Commission Internationale de l’Eclairage (CIE) did measurements on the vision of hundreds of humans. From those data, several color spaces were created to make communication about colors easy and unambiguous. In 1976, the CIE recommended the use of two approximately perceptually uniform color spaces and colordifference formulas. These spaces have become known by their officially recommended abbreviations CIELAB and CIELUV. In the former, a color is described by three coordinates: L (lightness), α (red-green scale), and b (yellow-blue scale). We will use this space to describe the colors of the Moscow metro map in terms of numbers: their CIELAB coordinates can be found in Table 1; Figure 3 shows a stereographical plot of the colors of the Moscow metro in the CIELAB space.

Figure 3. A stereographical image of the colors of the Moscow metro map at their location in the CIELAB space. The L-axis is the vertical axis, the a-axis runs from southwest to northeast, and the b-axis from southeast to northwest. (To see a 3-dimensional picture, view the left picture with your left eye and the right picture with your right eye at the same time.) Credit: Simone F. Griffioen
The CIELAB space itself is not bounded; however, based on what one wants to measure, only part of it matters in practice (for example, only the colors that a printer can print or only the colors the human eye can see). Such a subset of colors is called a color gamut. The gamut of Adobe 98 in the CIELAB space can be seen in Figure 4. To keep the problem simple, we approximate this gamut by a polyhedron. Because the CIELAB space was supposed to be almost perceptually uniform, the Euclidean distance gives the CIE 1976 color difference formula (CIE76)

In fact, the CIELAB space is not really uniform. In particular, at high values of a and b, the far-too-simple CIE76 formula values color differences too strongly compared to the experimental results on color perception. This is why several new color-difference formulas were proposed, of which the newest is the CIEDE2000 formula (or ΔΕ00).

Figure 4. The gamut of Adobe 98 in the CIELAB space. We approximate this gamut by a polyhedron by taking the corner points of this polyhedron close to the points A, . . . H in the figure. Credit: Simone F. Griffioen
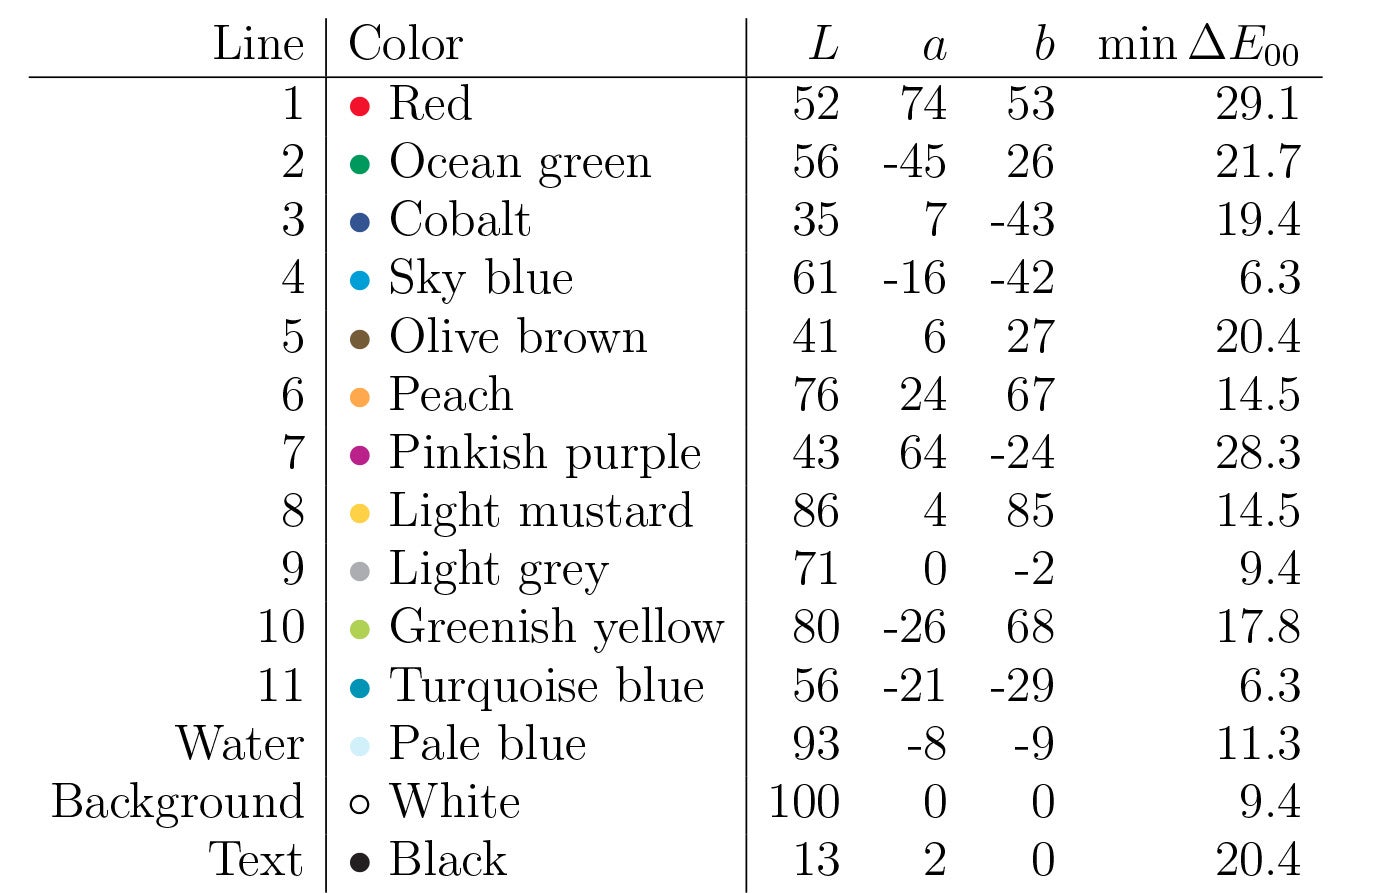
Table 1. Coordinates of colors on the Moscow metro map. The names of the colors come from [8]. The average minimal distance is 16.3. Note that some of the minimal distances are the same; this happens when the two points are the closest to each other. Credit: Simone F. Griffioen
2. Mathematical Formulation of the Problem
Given the CIELAB space equipped with the Euclidean metric—or even better, the CIEDE2000 color difference formula—and the color gamut Γ (which we chose to be a polyhedron), we consider a set of existing colors Ρ = {p1, . . . , pk} within this gamut, represented by their CIELAB coordinates (e.g., see Table 1). If we want to add only one new line, this leads to the following maximin problem:
Problem 1 (one new color). How can we find an x ∈ Γ such that

That is, the minimal distance from the new color x to the existing ones must be as large as possible, provided that the color x stays inside or on the boundary of the gamut Γ. If we want to add several new lines, each having its own new color, the maximin problem becomes this:

That is, we maximize both the minimal distance in between the new colors x1, . . . , xm and their minimal distance to the old colors. Alternatively, we could add the new colors x1, . . . , xm one by one, using a method for solving Problem 1. However this does not always yield the optimal result.
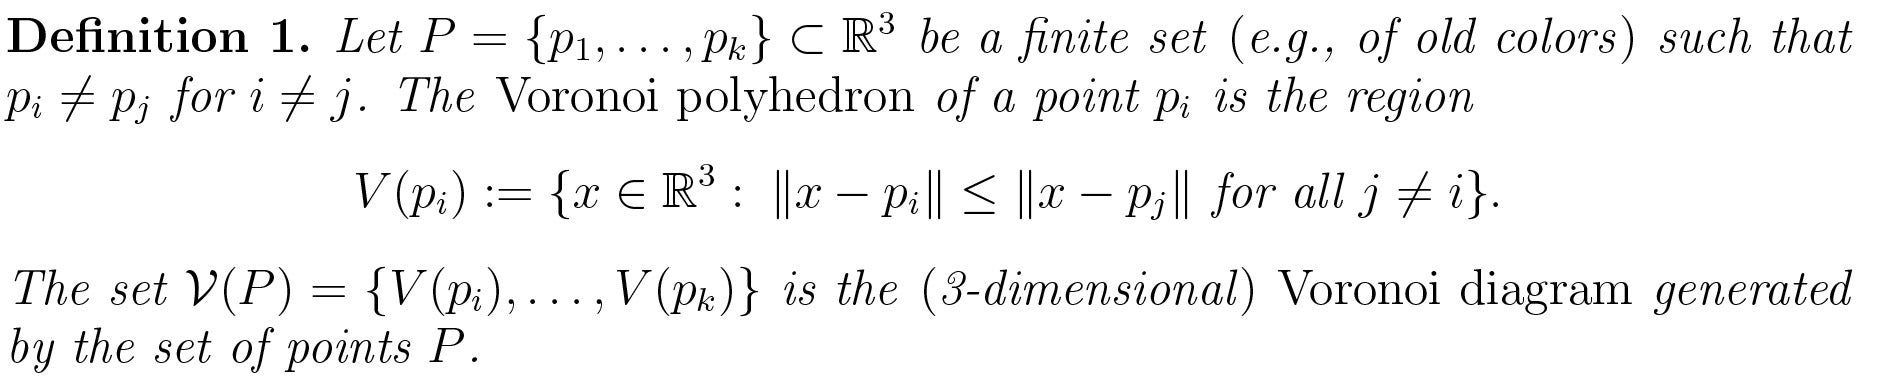
3. The Voronoi Diagram Method
Let us consider Problem 1. Because the CIELAB space is continuous (at least in principle), it is impossible to “try all points” in the gamut to find the one with the maximal minimal distance. Therefore it would be much easier to have only a finite number of candidate points to check. This can be achieved by using Voronoi diagrams.
It is easily shown that the sought-for point x maximizing the minimal distance in Problem 1 belongs to the intersection of
either: three Voronoi planes, that is, three faces of Voronoi polyhedra,
or: two Voronoi planes and a boundary plane of the gamut,
or: a Voronoi plane and two boundary planes,
or: three boundary planes.
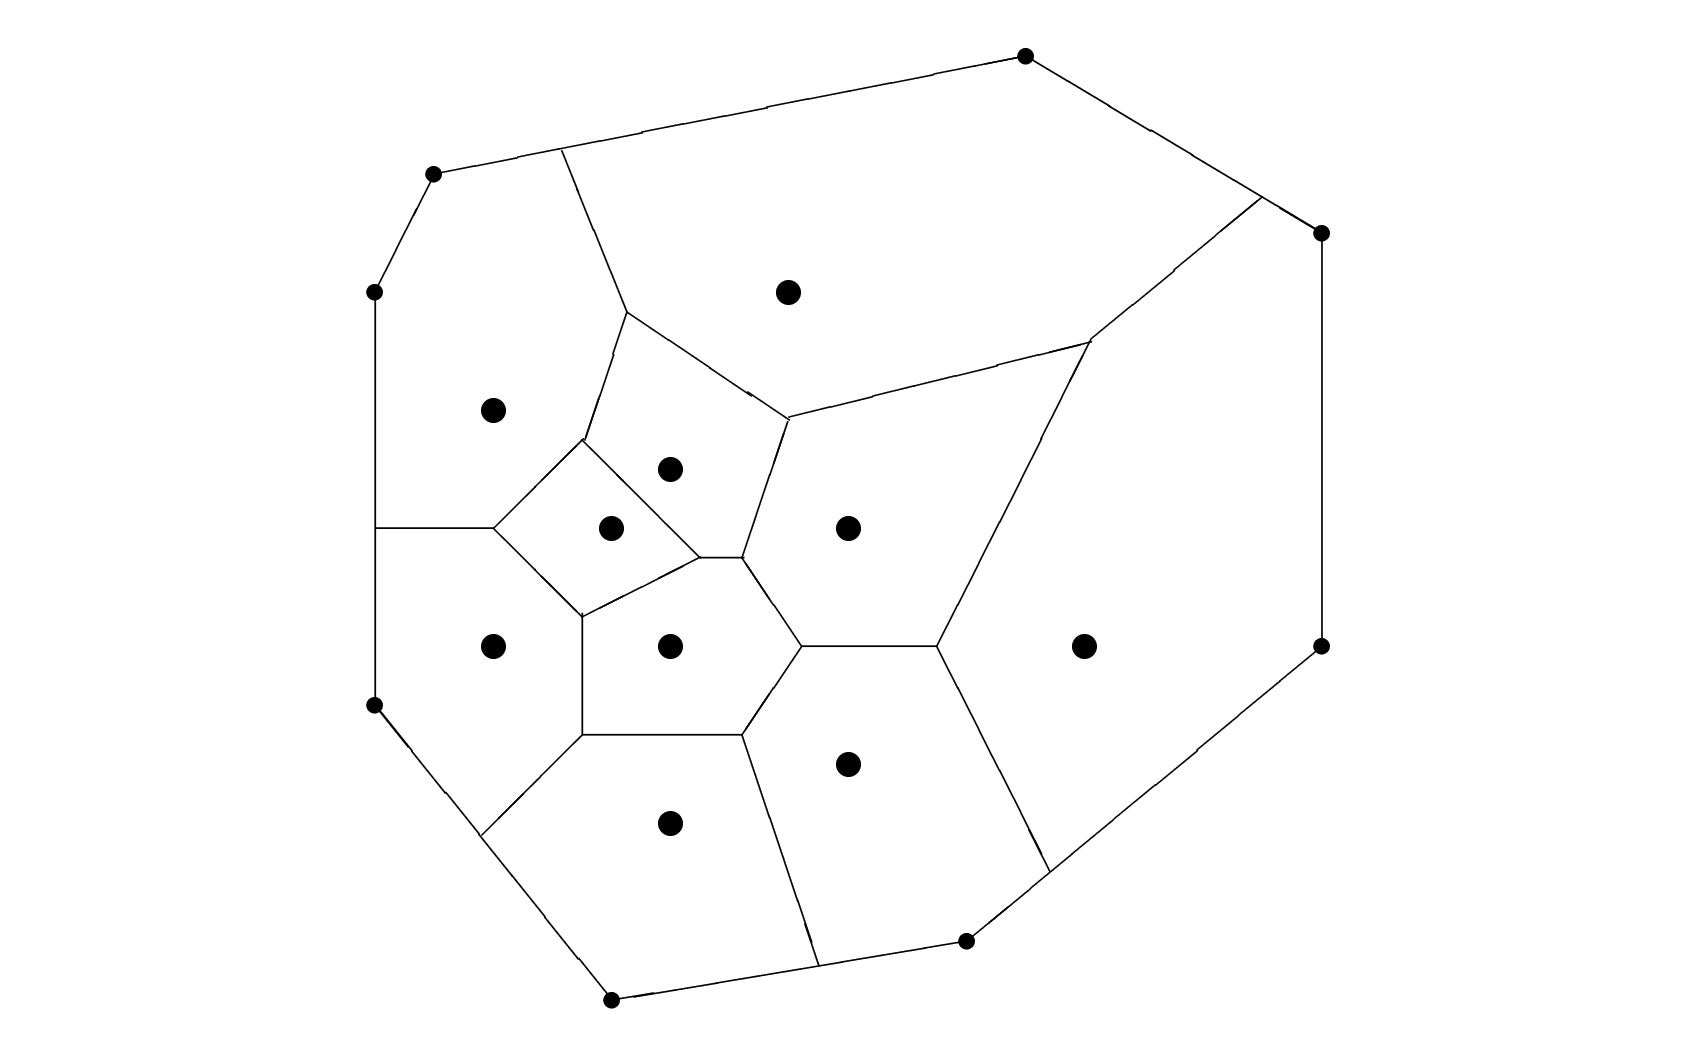
Figure 5. A 2-dimensional Voronoi diagram. Note that all edges of the Voronoi polygons are parts of the bisectors of lines connecting two points in the diagram. Credit: Simone F. Griffioen
This means that as soon as these candidate points are calculated, it only remains to compare their minimal distances to the existing points pi ∈ P, and then to take the one whose distance is maximal; in fact, the resulting set is finite and reasonably small. This is the CIE76 Voronoi method of solving Problem 1 with respect to the Euclidean distance. In Table 2 we list the five new colors that we obtained, one by one, for the Moscow metro by using this method.
It is readily seen that the Voronoi method would provide the global optimal solution to maximin Problem 1—if there were a perceptually uniform color space. This is not yet the case nowadays, therefore let us study how better estimates can be obtained.
Because the CIEDE2000 distance is much more accurate than the Euclidean distance, we can improve our method by selecting the optimal point from the candidate points by comparing the ΔΕ00 distances instead of the Euclidean distances ΔΕαb. This is the combined CIE76-CIEDE2000 Voronoi method. Of course, this method does not solve Problem 1 with respect to ΔΕ00 alone, because the candidate points are found by using ΔΕαb. However it is a fast method to obtain colors by using the CIEDE2000 distance. The five new colors obtained, one by one, for the Moscow metro by this method are given in Table 3. We see that this gives us much better solutions with respect to the CIEDE2000 distance than the Voronoi CIE76 method: indeed, the ΔΕ00 distance drops at a much slower rate.
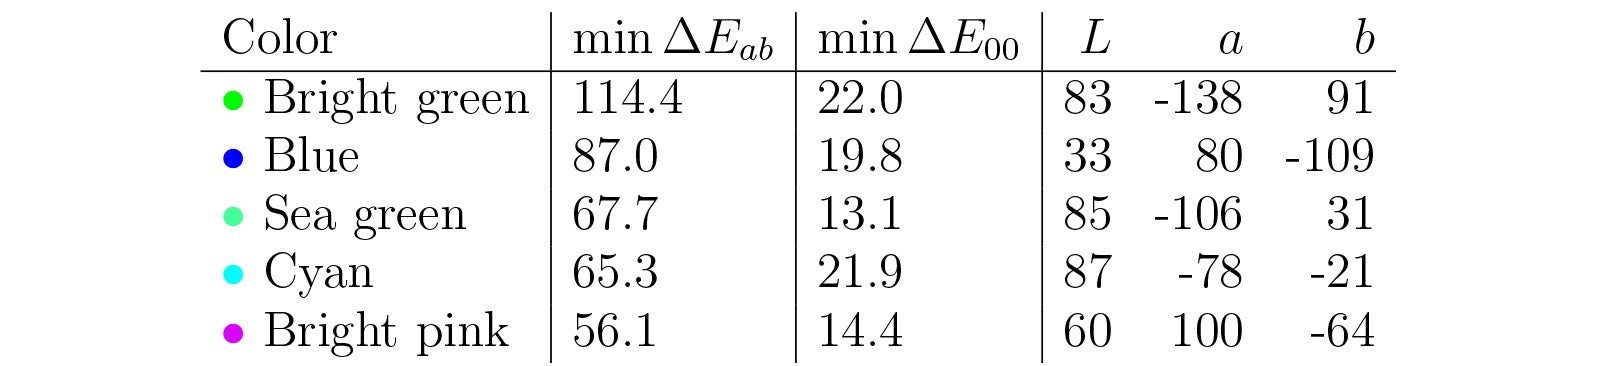
Table 2. Colors we find one by one for the first five new lines in the Moscow metro by using the CIE76 Voronoi method, that is, by solving Problem 1 with respect to the Euclidean distance. The minimal distances that we indicate here take in account the points that came earlier into the table. Note that the minimal ΔΕ00 distance is then not necessarily decreasing. Credit: Simone F. Griffioen
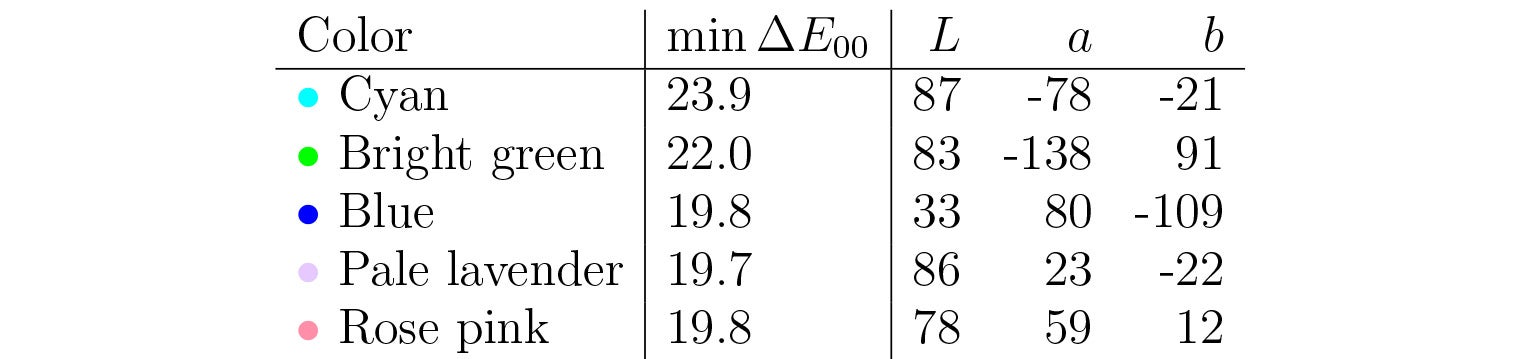
Table 3. Colors we find one by one for the first five new lines using the combined CIE76-CIEDE2000 Voronoi method. Note that the distances here are the CIEDE2000 distances, and they drop at a much slower rate than in Table 2. Credit: Simone F. Griffioen
4. The Simplex Method
We can also solve Problem 2 with respect to the Euclidean distance by using the simplex method. Let us consider here the case when the number of colors m is two, which gives us the following function to maximize,

We have (x, y) ∈ Γ×Γ ⊂ ℝ6 . Let us rewrite our problem: first, put one extra parameter x0 and the two vectors x, y together in x = (x0, x, y) ∈ ℝ7 , and now maximize the function M0(x) = x0 over all x ∈ ℝ × Γ × Γ satisfying the constraints
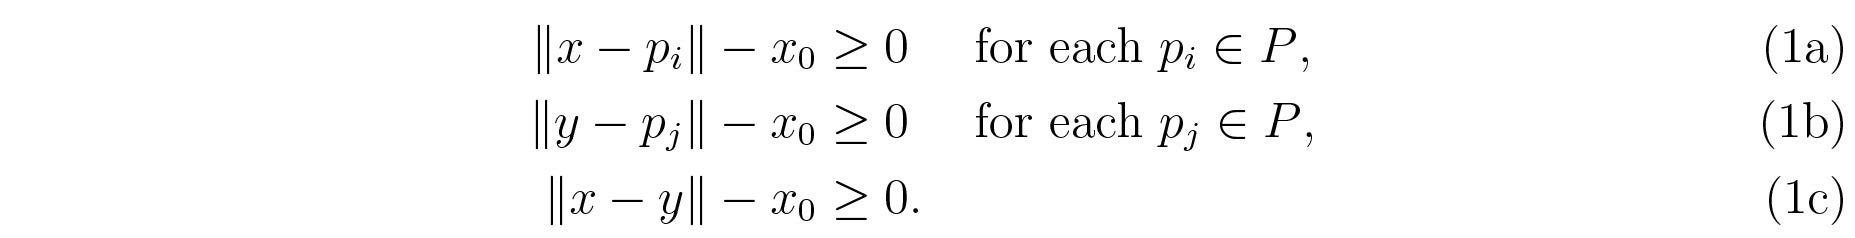
Of course, more constraints on (x, y) are used to delimit the set Γ × Γ. Now we use the simplex method to maximize our function.
The gamut’s boundary gives the linear constraints, and the nonlinear constraint functions are equations (1). Because the simplex method gives us only a local optimum, we apply it for a million random initial points (x0, x, y) ℝ7 (with x0 ∈ [0, 20] and (x, y) ∈ Γ × Γ). These are local optima with respect to the ΔΕαb distance; let us now choose the one with maximal ΔΕ00 distance. This way, we obtain the two colors
Bright aqua • (84, -65, -12) and Baby pink • (86, 35, 7).
Their combined minimal CIEDE2000 distance to the old colors and each other is 22,7. This is more than the minimal distance that was obtained after two steps of the oneby-one CIE76-CIEDE2000 Voronoi method. So this gives us a better result for solving Problem 2. However, this method is quite time-consuming (as m increases, the simplex method will need even more time), so the much faster Voronoi method is a good alternative.
5. Conclusion and Discussion
We conclude that the Voronoi diagram method (and its improvement by using both the CIE76 and CIEDE2000 distance functions) for adding new colors one by one gives solutions that are comparable with the ones produced by the nonsmooth optimization method for finding two or more new colors at once. This is true for the map of the Moscow metro under study. Other solution schemes are of course possible, for example the Monte-Carlo method: test points xi ∈ Γ for the new color(s) are generated within the gamut at random, and the new color—or a tuple of new colors—is the maximin optimum over a sufficiently large number of such attempts. The ballistic method is realized as follows: first, suppose that each old color pi ∈ Γ and every new point xj in the sought-for tuple carries a positive electric charge (so that they repulse by Coulomb’s law). To prevent an escape of new points from the gamut Γ across its boundary, put a negligibly small but positive charge at the boundary’s closest point to xj for every j. By starting from random initial data xj (0) ∈ Γ, the configurations {xj (t)} of charges evolve inside the polyhedron Γ, which, by assumption, is filled with a viscous medium so that the new points’ motion slows down; sooner or later they are captured near the local minima of the potential (see [1] for details on both methods).
Finding several new colors is still not all that one needs in order to paint the new lines on a metro map. Clearly, it is the configuration of transfers from the old to new lines that must further be taken into account—to distribute the new colors between the new lines in such a way that at every transfer station, the colors of intersecting lines are maximally different.
Breaking News: An Online Poll. The 16.8-km long Kozhukhovskaya line with eight stations on it is scheduled to appear in the Moscow underground system in 2015–2016, officials say. The new line will connect the (south)east with the city centre, see Fig. 6: starting at the ocean green, that line continues along the turquoise blue toward red.

Figure 6. The extension plans for the Moscow metro.
Credit: Wikimedia (CC BY-SA 3.0)
Two colors, to freely choose from, were offered to preregistered “active citizens” during an interactive poll, which was held from 20 October until 10 November 2014. Namely, black and pink were claimed as the only colors remaining from the gamut that were not yet used to paint lines on the Moscow metro map (see Figure 1). As many as 307,350 active citizens took part in the online poll, media report; 71% voted pink and 18% preferred black, whereas 7% trusted the choice to experts (such as designers, ethnographers, or psychologists). Finally, 4% of the respondents either made their own suggestions of the new color: turquoise, olive, coral, etc.—or even proposed to make that line on the map speckled (see [12, 13]).
This article from The Mathematical Intelligencer was reprinted with permission. It was originally published in January 2016.
