
The National Hurricane Center is stepping up its warnings about storm surge and will start publishing maps this summer that show where tropical storms are likely to cause flooding along the Atlantic and Gulf coasts.
Storm surge color maps will perform the same warning function as the center’s traditional hurricane maps, which President Trump famously altered last year with a Sharpie to inaccurately show Hurricane Dorian possibly hitting Alabama.
The new storm surge maps will highlight in red the coastal areas that face possible flooding and will show the expected height of the storm surge at numerous locations. The maps are meant to warn the public of a potential danger that is often overlooked as people focus on hurricane wind speeds and likely storm paths.
On supporting science journalism
If you're enjoying this article, consider supporting our award-winning journalism by subscribing. By purchasing a subscription you are helping to ensure the future of impactful stories about the discoveries and ideas shaping our world today.
“It’s easier to quickly convey the areas where you expect the storm surge to occur using a graphic,” said Michael Brennan, branch chief of the hurricane center’s Miami-based Hurricane Specialist Unit.
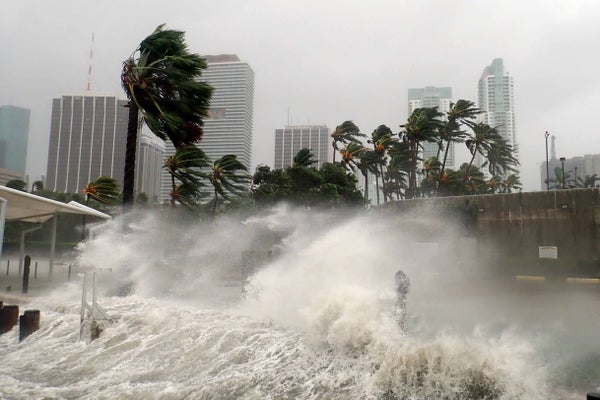
Hurricane-related storm surge is a deadly threat that causes dangerous flooding in communities along the coastal U.S. It also reaches inland to affect bays and sounds. Superstorm Sandy, which had been a weak hurricane prior to making landfall in 2012, created a storm surge that caused billions of dollars in damage along the heavily populated coasts of New York and New Jersey.
Hurricane Irma from 2017 caused massive storm surge flooding in northeastern Florida, leading to four deaths, even though the storm made landfall in the southeastern part of the state. Irma’s storm surge also damaged Puerto Rico and the U.S. Virgin Islands, even though the hurricane did not hit either of the territories.
The hurricane center will publish the maps roughly 48 hours before hurricane winds or surges are expected to hit the Gulf Coast, Atlantic Coast, Puerto Rico or the Virgin Islands. The maps will use data the hurricane center has long collected.
“This is a great idea to be providing this information,” said Anna Weber, a senior policy analyst at the Natural Resources Defense Council specializing in coastal resilience. “Maps and graphics are a lot more compelling than tables of numbers.”
A 2017 law called the Weather Research and Forecasting Innovation Act directed NOAA, which oversees the hurricane center, to improve “the forecast and communication of storm surges from hurricanes.”
Brennan said the center recognized on its own the need for better visual display of possible storm surge flooding.
The hurricane center currently publishes a variety of graphics that depict hurricane wind speeds, likely paths and arrival times. The map altered by Trump in August—“Hurricane Dorian Forecast Track and Intensity”—showed Dorian moving through the Caribbean aimed squarely at Florida.
Trump added a bizarre loop in black ink to show incorrectly that Dorian might hit southeastern Alabama.
Weber of NRDC said she could foresee a new storm surge map “getting misinterpreted and unintentionally being used to spread bad information."
Brennan said the maps will show explanatory information such as the time when flooding is likely to occur in addition to the expected height of the storm surge.
Reprinted from Climatewire with permission from E&E News. E&E provides daily coverage of essential energy and environmental news at www.eenews.net.