
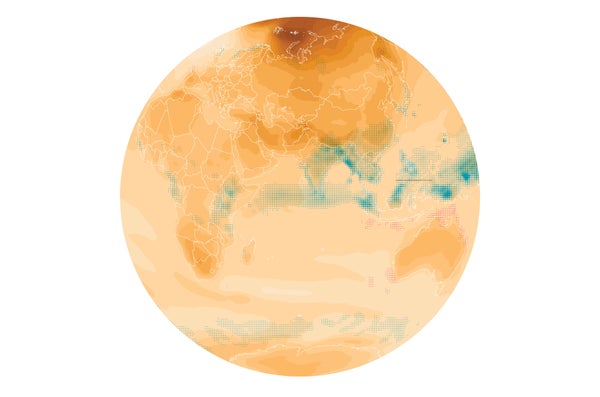
No one knows whether human consciousness will reside on a computer chip by the end of the century or even if self-driving cars will rule the road. But this much is certain: Earth is going to get hotter. The maps displayed here forecast how much warmer our planet will be in the year 2100 and how precipitation patterns will change. To make the figures, Scientific American worked with earth scientists at the nasa Ames Research Center. The researchers used high-resolution climate models from the Intergovernmental Panel on Climate Change to generate climate data for nearly every point on the planet, for every month of every year, through the end of the century. Our graphic presents a middle-of-the-road emissions scenario—it assumes that the world curbs greenhouse gases by midcentury but that substantial warming still takes place.
An estimated 10 billion people will inhabit that warmer world. Some will become climate refugees—moving away from areas where unbearable temperatures are the norm and where rising water has claimed homes. In most cases, however, policy experts foresee relatively small movement within a country's borders. Most people—and communities, cities and nations—will adapt in place. We have highlighted roughly a dozen hotspots where climate change will disrupt humanity's living conditions and livelihoods, along with the strategies those communities are adopting to prepare for such a future.
Click or tap to enlarge
On supporting science journalism
If you're enjoying this article, consider supporting our award-winning journalism by subscribing. By purchasing a subscription you are helping to ensure the future of impactful stories about the discoveries and ideas shaping our world today.

SOURCES: NASA EARTH EXCHANGE GLOBAL DAILY DOWNSCALED PROJECTIONS (NEX-GDDP) (main map and monsoon insets); NOAA OFFICE FOR COASTAL MANAGEMENT (Florida inset); Maps by Katie Peek

SOURCES: NASA EARTH EXCHANGE GLOBAL DAILY DOWNSCALED PROJECTIONS (NEX-GDDP); Maps by Katie Peek
