Illustrating Mental Illness

Researcher embraces data art as a way to diagram her own anxieties

Join Our Community of Science Lovers!

This article was published in Scientific American’s former blog network and reflects the views of the author, not necessarily those of Scientific American


On supporting science journalism

If you're enjoying this article, consider supporting our award-winning journalism by subscribing. By purchasing a subscription you are helping to ensure the future of impactful stories about the discoveries and ideas shaping our world today.


This week, as Mental Health Awareness Month draws to a close, I’m compelled to share an example of how data visualization can be many things we don’t necessarily expect it to be—personal, moving, equal parts imaginative and meticulous. Jill Simpson, a sociology research fellow at the University of York, recently published an article on visualizing mental illness, accompanied by a hand-drawn diagram documenting a day in her own life as a person with anxiety and Obsessive Compulsive Disorder (commonly known as OCD).
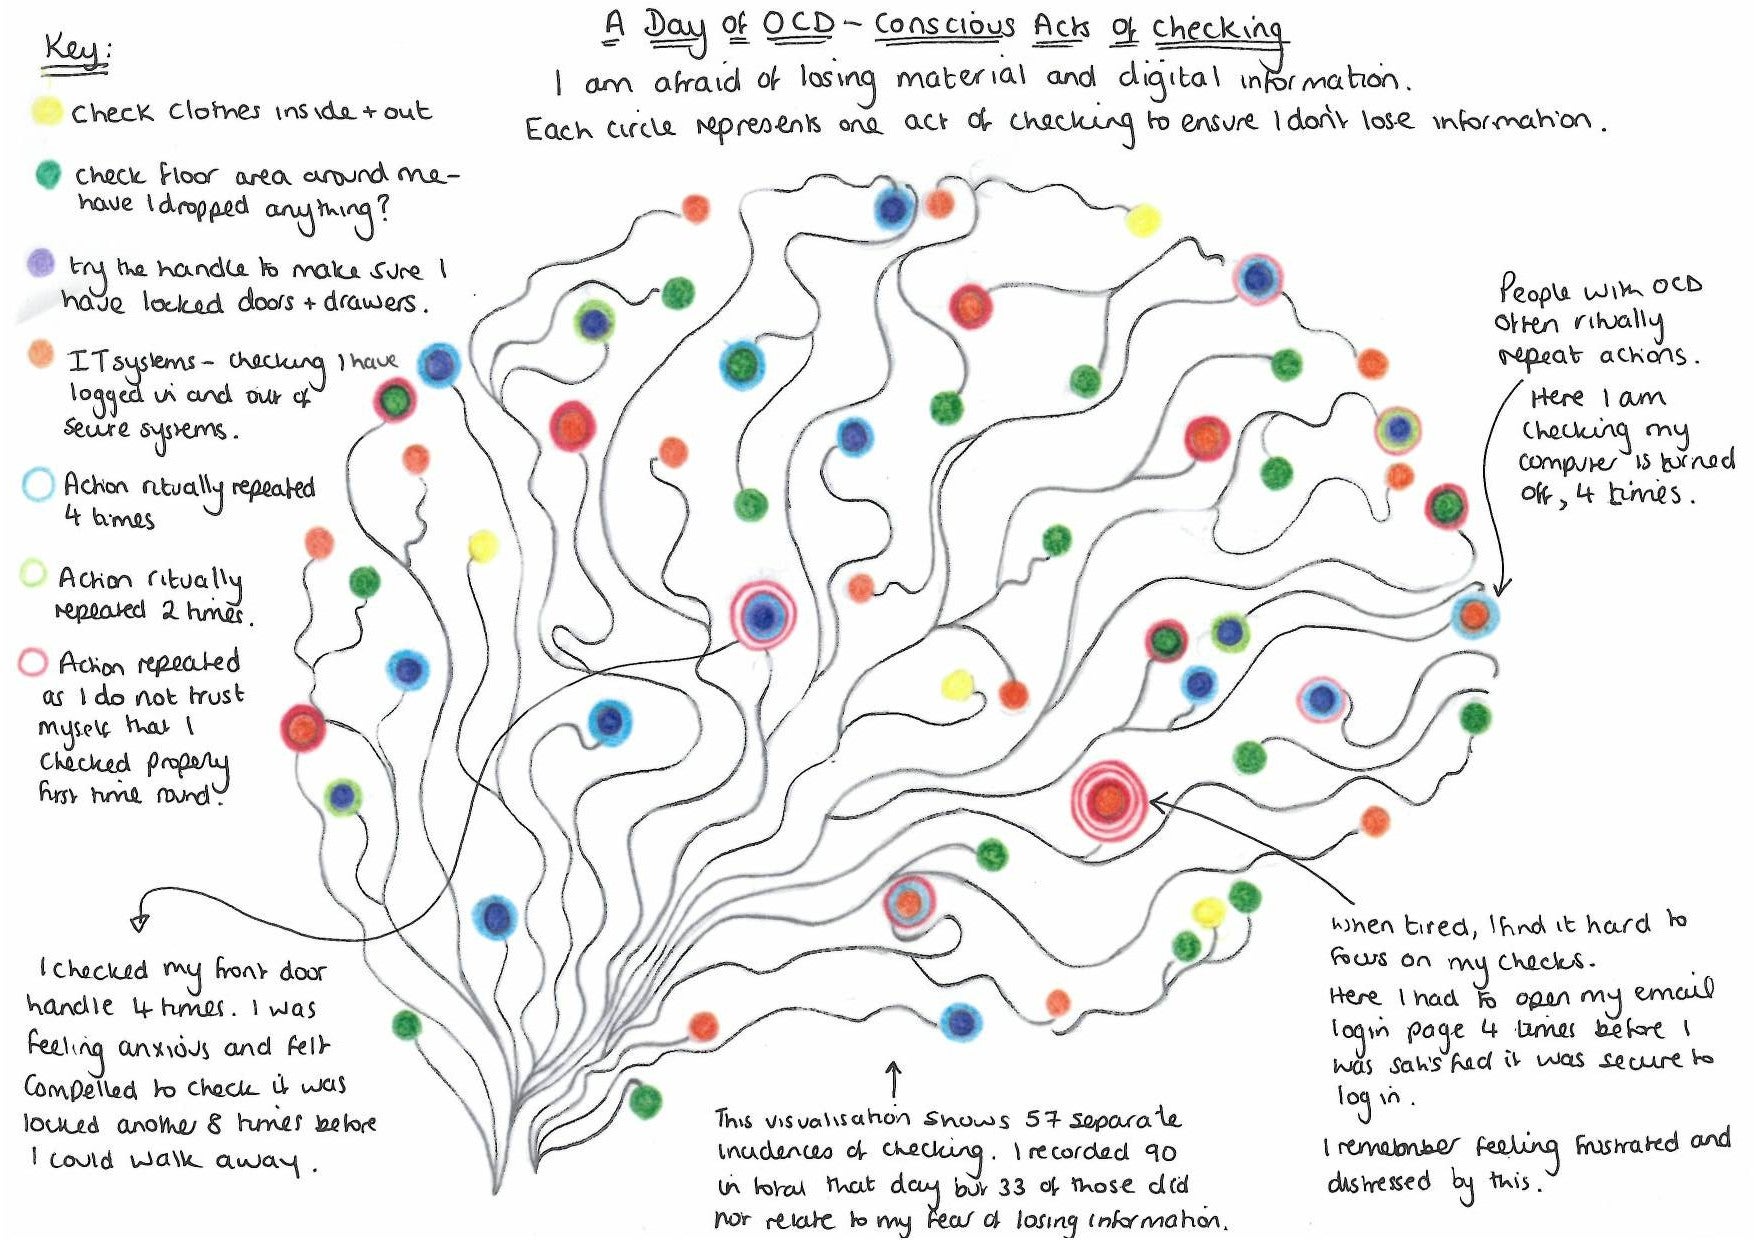
Credit: Jill Simpson

Apparently drawing inspiration from Giorgia Lupi’s and Stefanie Posavec’s Dear Data project, Simpson drives home some crucial messages. First, conditions like OCD are real and tangible health issues that don’t deserve be minimized as they often are in our culture. Second, everyone’s experience with mental illness is unique—this seems self-evident, but the specific and intimate nature of Simpson’s drawing reveals something essential that a list of symptoms simply cannot encompass. And finally, data visualization can be a powerful tool for communication and understanding, not only among people, but also within oneself.

Amanda Montañez is senior graphics editor and been at Scientific American since 2015. She produces and art directs information graphics for the Scientific American website and print magazine. Montañez has a bachelor's degree in studio art from Smith College and a master's in biomedical communications from the University of Toronto. Before starting in journalism, she worked as a freelance medical illustrator. Follow her on Bluesky @unamandita.bsky.social

More by Amanda Montañez

Subscribe to Support Independent Journalism

Great science journalism requires human expertise, time, effort and creativity. And it costs money. That’s why I and the journalists here at Scientific American hope you’ll join our community.

When you subscribe, you are supporting staff and freelance journalists who are passionate about telling science stories that are true, important and compelling. Our editors and reporters are often experts in their fields, which means they understand the nuances of big discoveries and can untangle the breakthroughs from the hype. With a subscription, you are also supporting rigorous fact-checking to ensure the words we publish are precise and accurate. And you’re supporting original illustrations, graphics and photos that bring you closer to an advanced laboratory, an ice sheet in Antarctica or a space mission in orbit. You’re helping us craft other types of high-quality journalism as well: Our newsletters are carefully written, edited and curated by staffers you have or will come to know and love. Our Science Quickly podcast is based on original reporting, collaboration with editors and scientists and exacting production.

Subscriptions keep this engine running so we can continue to deliver thoughtful, rigorous and independent science journalism to you. In an era of viral misinformation, this work is crucial. If you value what we do, I hope you’ll consider joining us as a subscriber

Thank you,

Jeanna Bryner, Editor in Chief, Scientific American

Subscribe