

Emily Schwing: This is Scientific American’s 60-Second Science. I’m Emily Schwing.
The world may have just come to understand the nature of disease epidemics over the last year, but for more than two decades, David Earn has been working on his own understanding of infectious diseases, and he’s using math to explain it all.
David Earn: I’m particularly interested in patterns of epidemics that have occurred in the past—and seeing what we can understand about disease spread in the past and hope to learn about disease spread in the future from that.
On supporting science journalism
If you're enjoying this article, consider supporting our award-winning journalism by subscribing. By purchasing a subscription you are helping to ensure the future of impactful stories about the discoveries and ideas shaping our world today.
Schwing: Earn is an applied mathematician at Ontario’s McMaster University. His research explores factors that contribute to how diseases spread among people. And he has become an expert in tracking down the historic documents about long-ago epidemics that still hold mathematical clues we can learn from today.
Key to all this is his team’s knack for digital sleuthing. Early on in his career, Earn recognized that he could uncover numbers of deaths and their causes in Europe by sifting through piles of old records. They’re called bills of mortality, and he’s found thousands of them.
Earn: Deaths started being registered in 1538. If we were to look, over time, at all of them—they were published weekly over hundreds of years—we’d see a pattern, and that would be potentially very enlightening.
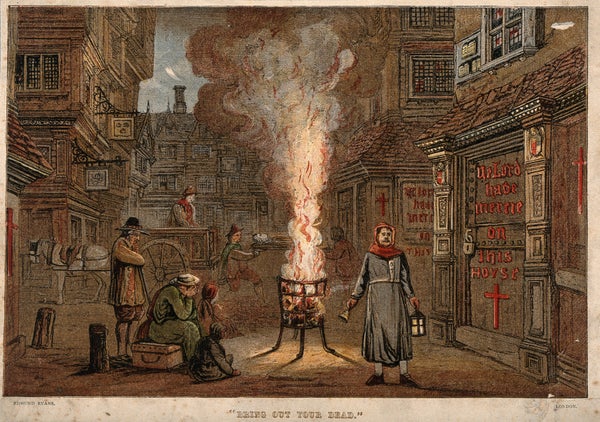
Schwing: Earn started looking for one such pattern in London during the 1660s. That’s when a pestilence called the Great Plague ripped through the city. Bubonic plague was the culprit. It’s an infectious disease spread by rat-biting fleas.
Earn knew all about that. What he didn’t know was what the pattern of transmission looked likeover time.
Earn: So typical epidemics—what happens is a pathogen enters a population, and somebody’s infected, and they infect others. And initially, when almost everybody is susceptible to the infection, you see exponential growth of cases of deaths or both. But eventually, so many people have been infected or become immune that, in effect, the epidemic turns over, and you start to see a reduction in the number of cases, each day or each week.
Schwing: If, like David Earn, you plot out the number of cases, over time, for an individual epidemic, you’ll see an exponential rise and then a turnover and then another rise, and so on.
Earn: It’s kind of like a skewed bell.
Schwing: And that plot can answer a lot of questions:
Earn: How quick that exponential rise is beginning. How high does it go? How rapidly does it turn over? The structure of the epidemic—what’s called the epidemic curve.
Schwing: The answers to some of these questions were sitting, hidden in plain sight for centuries at London’s Guildhall Library, where Earn and his team found hundreds of pages of yellowing parchment.
The city, as it turns out, started its own health surveillance system back in the early 1600s. Now Earn and the rest of his team had access to weekly plague death counts in each of the 130 parishes that made up the city.
The death counts were key to understanding the speed of spread. But the fact that they were tied to a spatial grid gave them something more: it revealed the movements of an invisible killer.
Earn and colleagues found that the number of deadly infections doubled every 11 days. He was also able to tease out very strong evidence that a wave of death washed from the outskirts into the city center over a period of many months in 1665.
In a year and a half, a quarter of the population of one of Europe’s largest cities was dead. The human toll was shocking. But what the team still didn’t know was how this compared to epidemics that played out centuries earlier.
Earn: The period of which the bills of mortality cover captures the Great Plague of London and a number of plague epidemics earlier. But we know there were earlier plague epidemics but no chance of finding mortality records before 1538, because the deaths weren’t registered.
Schwing: Earn was, again, stumped. How could he and his colleagues find out more about the dynamics of plague and its spread prior to the 1530s?
On a whim, a colleague simply did a google search for digitized last wills and testaments and found thousands more documents. They used the dates those wills were written as a proxy for the date of death and compiled them.
Earn: If you plot them out, and this is daily counts of wills, and you can see clearly all four plague epidemics from the 14th century, and that was really exciting.
Schwing: Through this new method, Earn discovered that the number of people killed by plague doubled only every 43 days during the Black Death.
It was the most deadly plague epidemic in human history, and it peaked in Europe between 1347 and 1351. Even so, the disease wasn’t moving through the population nearly as fast as Earn found it was in the 1660s.
Earn: You know, there was such a difference in the growth rate, or the doubling time, for a disease that, as far as we can tell, didn’t evolve in a significant way. You know, it spread four times as fast in the 17th century than in the 14th century. That’s not a small difference; that’s a huge change—a doubling time of around 10 days rather than several weeks.
Schwing: The team isn’t entirely sure exactly why the Great Plague in the 17th century spread four times faster than it did in the 1300s. The population in London increased from roughly 50,000 to 500,000 over those three centuries. They also suspect the weather might have played a role.
Earn: The wealthy were more congregated in the center later on. And the minimum of the Little Ice Age was actually in the 1600s, and so it was cooler during the Great Plague than during the invasion of the Black Death.
Schwing: Colder temperatures could have meant that people spend more time indoors in close quarters. You only have to look at the winter waves of our coronavirus epidemic to understand why that could contribute to faster spread.
Regardless of the details, the work has paid other dividends. Earn and colleagues have compiled a digitized archive of all of the historic documents they were able to scrape for data—a valuable data source for others also trying to understand the ways pandemics can spread.
They’ve also developed two different software tools to forecast infectious disease outbreaks and to study growth rates in real time for outbreaks like COVID-19.
Earn: We’ve been using it since the start of the epidemic in order to estimate growth rates and doubling times for COVID.
Schwing: The new software may have been developed with centuries-old data, but the real-time information it’s producing now informs policy makers and officials on the front lines of the global pandemic we’re all experiencing right now.
For 60-Second Science, I’m Emily Schwing.
[The above text is a transcript of this podcast.]
