New Issue: Orbital Catastrophe Ahead? Read Now

The number of kidney patients is going up

Chronic kidney disease has a variety of causes, ranging from immune system problems to medication side effects

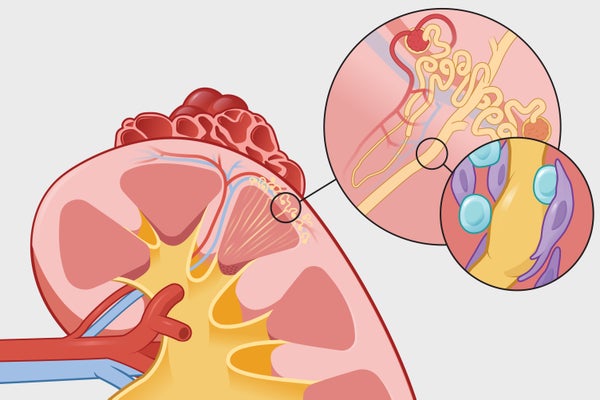
Detail of an illustration of the anatomy of a kidney.

Now Medical Studios

Join Our Community of Science Lovers!

This article is part of “Innovations In: Kidney Disease,” an editorially independent special report that was produced with financial support from Vertex.

The global burden of chronic kidney disease (CKD) is high and getting higher. In 2023 it was the ninth-leading cause of death for adults and the 12th-leading cause of healthy years lost to illness, disability or premature death. In the U.S., researchers estimate that more than one in seven adults have CKD. Nine in 10 of those people are not aware that they have it, but their kidneys will struggle to filter waste and extra water from the blood as they worsen.

CKD has many different triggers and is intertwined with a range of other illnesses, including cardiovascular disease and hypertension. An analysis published in 2025 showed that CKD is more common in regions with a high diabetes prevalence, such as Oceania and the Middle East. In other areas with high rates, the cause is attributed to genetic variants within regional populations, such as in West Africa and Central America. Variability across communities underscores the complex nature of this noninfectious disease.


On supporting science journalism

If you're enjoying this article, consider supporting our award-winning journalism by subscribing. By purchasing a subscription you are helping to ensure the future of impactful stories about the discoveries and ideas shaping our world today.


COUNTRIES THAT STRUGGLE AGAINST KIDNEY DISEASE

In 1990 an estimated 378 million people aged 20 and older were living with chronic kidney disease (CKD). By 2023 that number had increased to 788 million worldwide.

The total number of people over 20 with CKD in the U.S., standardized for age, has increased 5 percent since 1990, reaching 11.7 percent in 2023. The 2023 global average was even higher, at 14.2 percent. Countries with large populations, such as China, have a high number of cases, but often their rates are actually below the world average. Countries with the highest rates in 2023 are labeled.
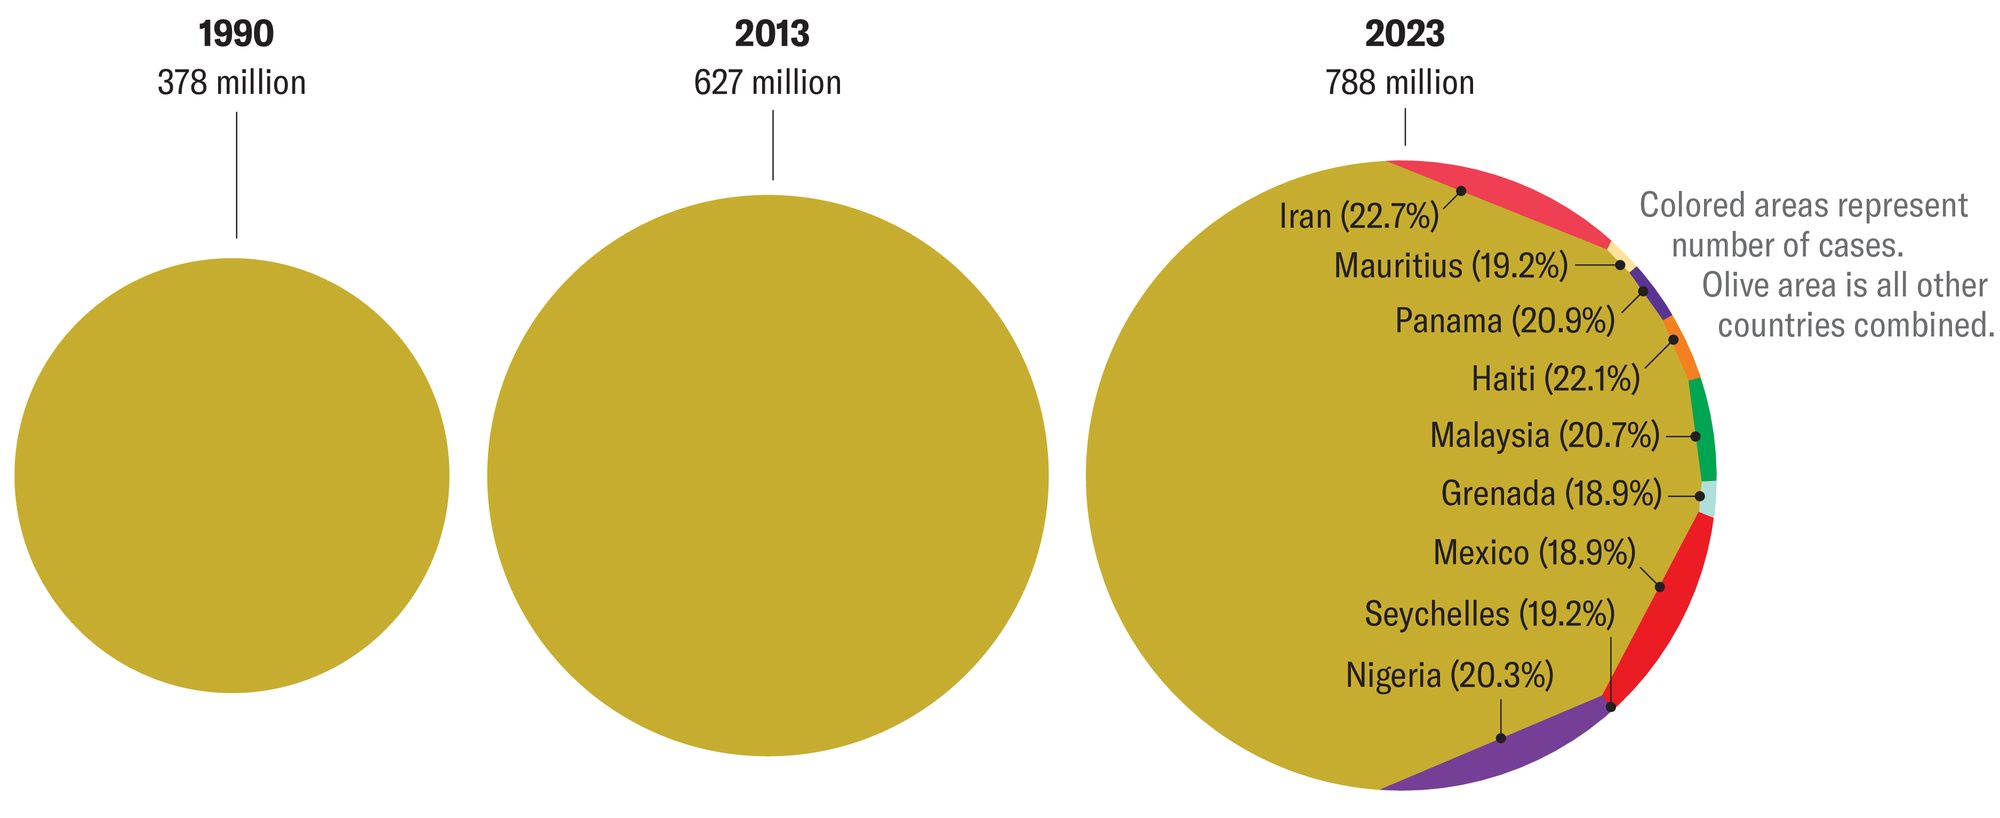
Bubble chart shows the number of people over 20 with CKD over time. The countries with the highest rate in 2023 were Iran (22.7%), Haiti (22.1%) and Panama (20.9%).

Part of that rise can be attributed to a population that’s increasing in both number and age. But CKD’s upward trend is outpacing those of several other leading causes of death.
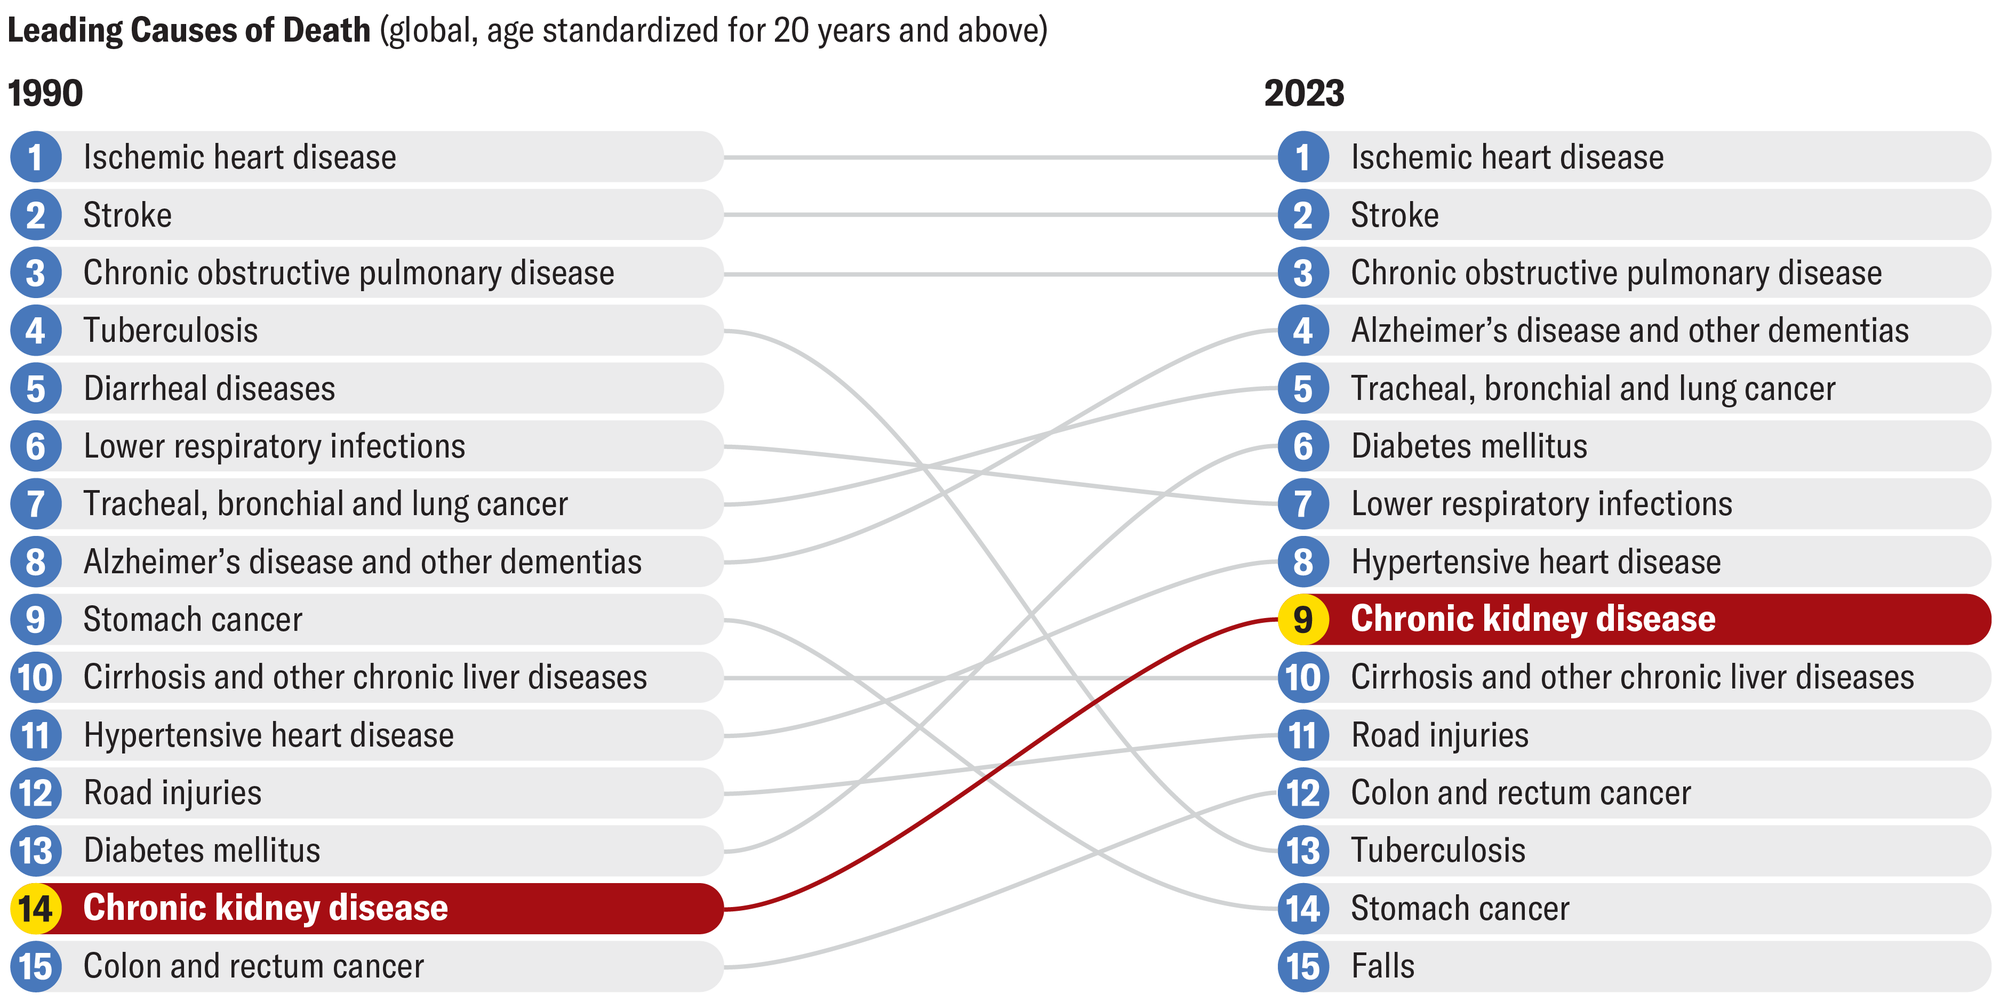
Table shows the leading causes of death (standardized for 20 years and above) in 1990 and 2023. Chronic disease went from 14th position in 1990 to 9th in 2023.

Jen Christiansen; Source: “Global, Regional, and National Burden of Chronic Kidney Disease in Adults, 1990–2023, and Its Attributable Risk Factors: A Systematic Analysis for the Global Burden of Disease Study 2023,” by Patrick B. Mark et al., in Lancet, Vol. 406; November 22, 2025 (data)

WHAT IS KIDNEY DISEASE?

Kidney disease is an umbrella term that includes a wide variety of causes, but in every case the condition disrupts the kidneys’ ability to filter waste and maintain balance in the body. It is classified based on the amount of damage and remaining kidney function.
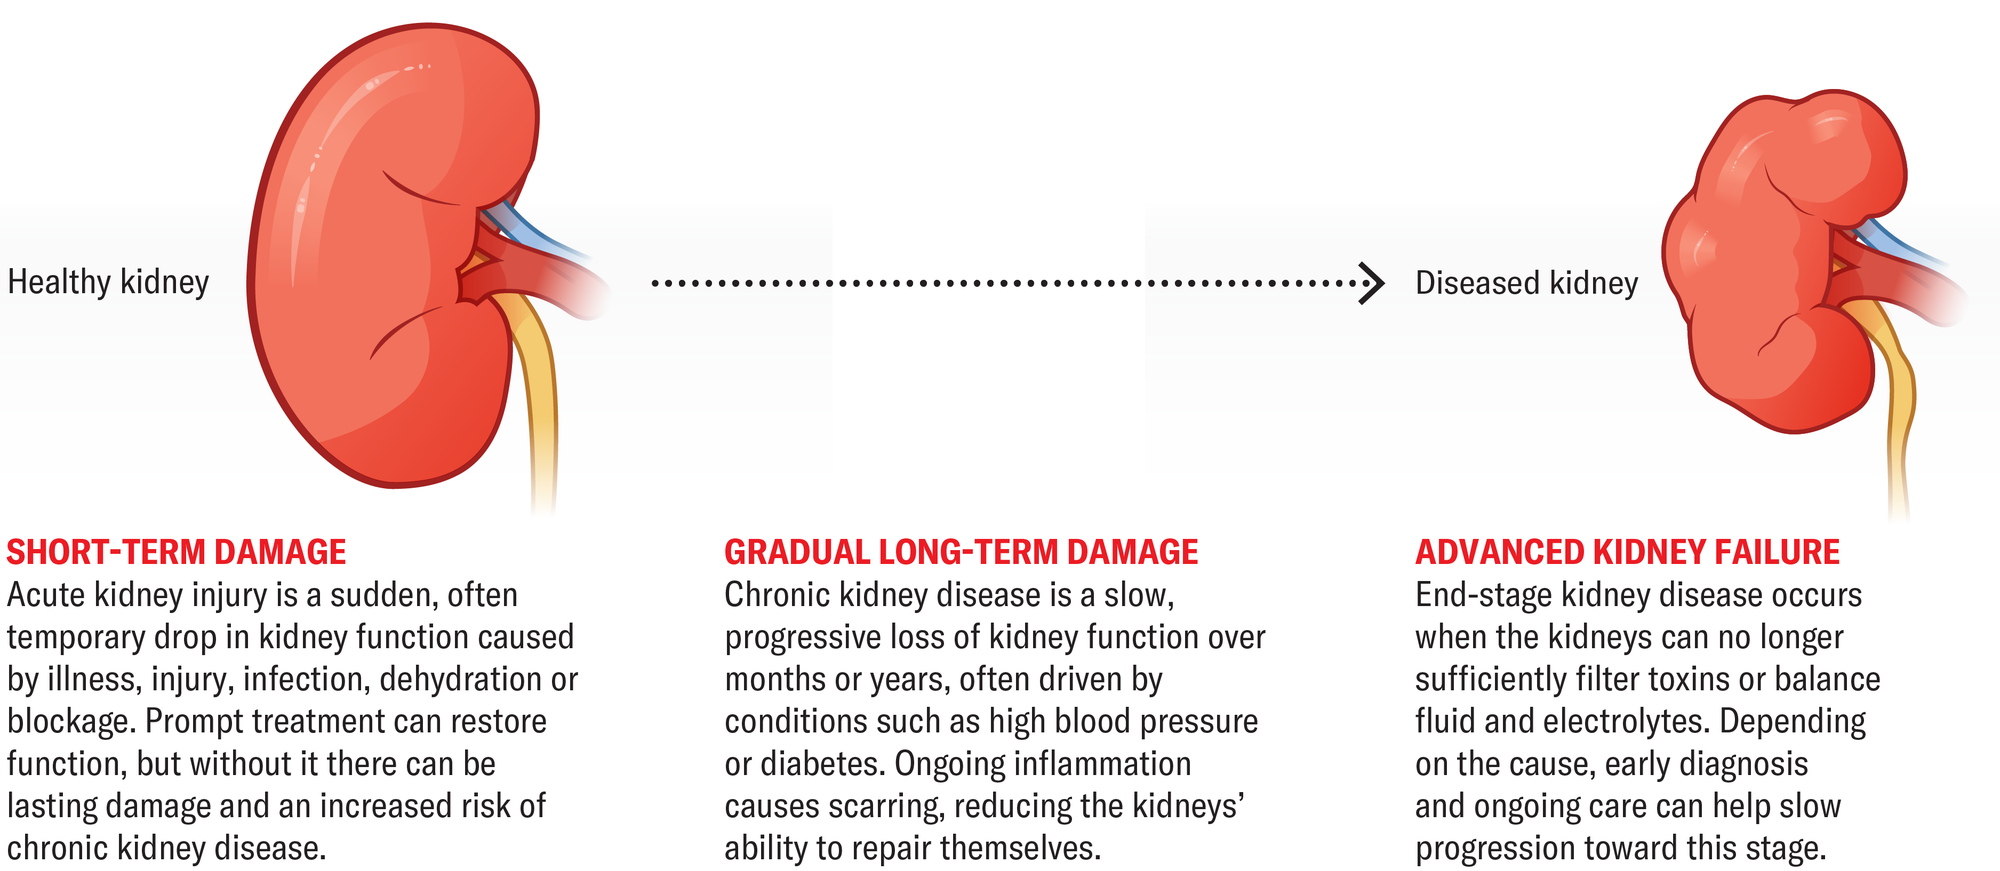
A healthy kidney illustration fades into a diseased kidney illustration, along a continuum of short-term damage to gradual long-term damage to advanced kidney failure.

How is Kidney Health Tracked?

Physicians divide chronic kidney disease (CKD) into five stages depending on how well the kidneys function, something that helps guide care. Because CKD usually develops gradually, stage-specific treatment can slow damage and keep the kidneys working as well as possible.
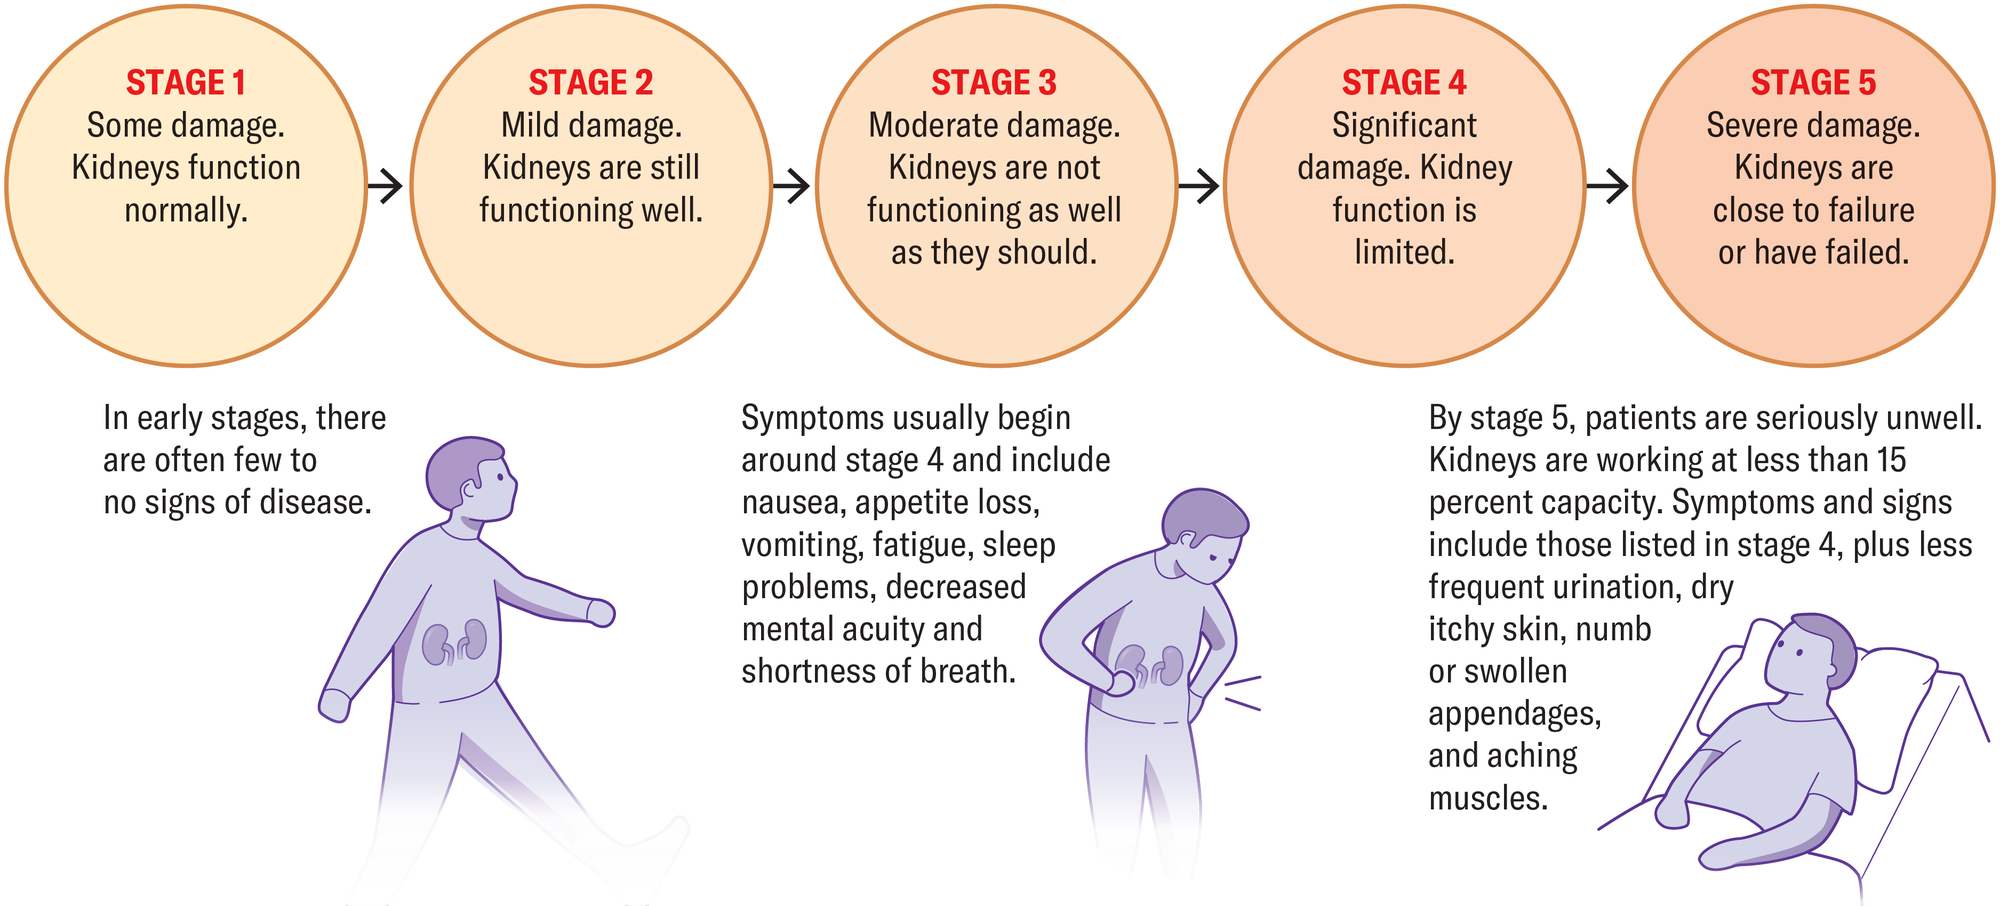
Graphic describes the 5 stages of CKD. In early stages, there are often few to no signs of disease. Symptoms usually begin around stage 4 and include nausea, appetite loss, vomiting, fatigue, sleep problems, decreased mental acuity and shortness of breath. By stage 5, patients are seriously unwell. Kidneys are working at less than 15 percent capacity.
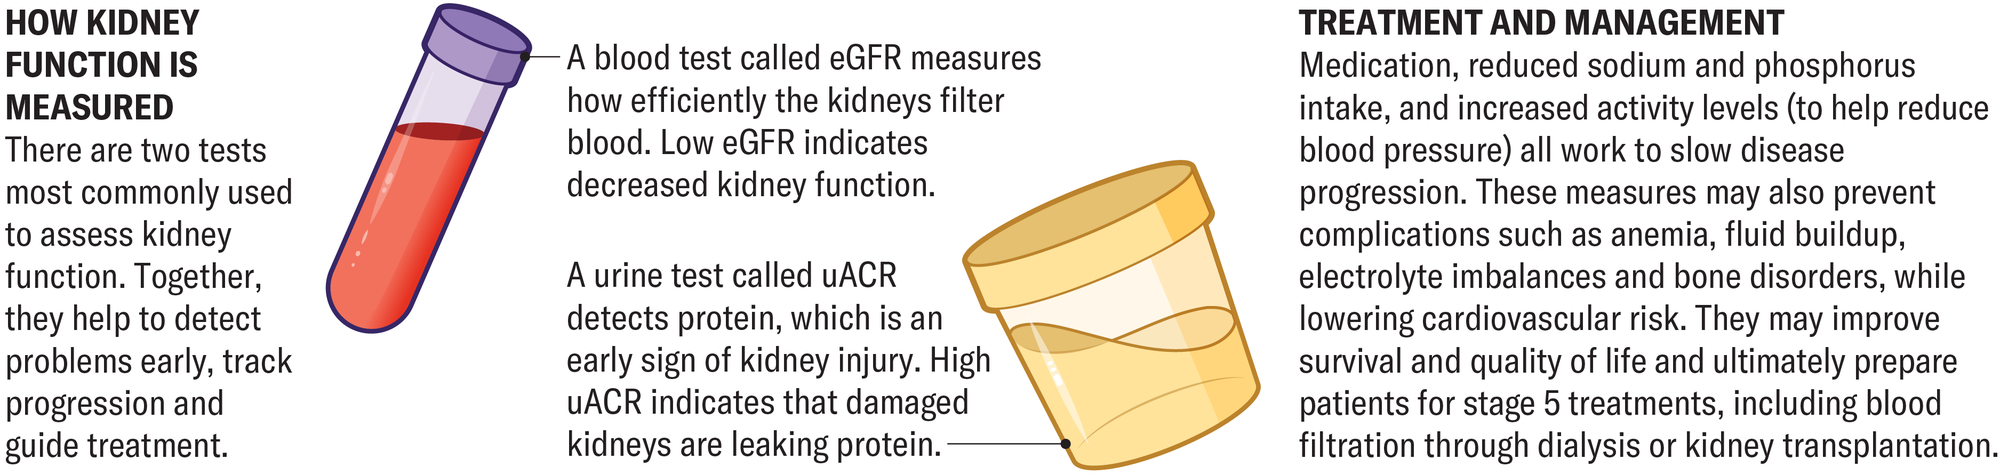
Panel describes how kidney function is measured. There are two tests most commonly used to assess kidney function. A blood test called eGFR measures how efficiently the kidneys filter blood. Low eGFR indicates decreased kidney function. A urine test called uACR detects protein, which is an early sign of kidney injury.

What puts your kidneys at risk?

Kidney injury is often triggered by certain medications or another medical condition, such as severe dehydration, a urinary tract blockage, or infection. Factors that fall within the following three categories can also increase the risk of developing the disease.
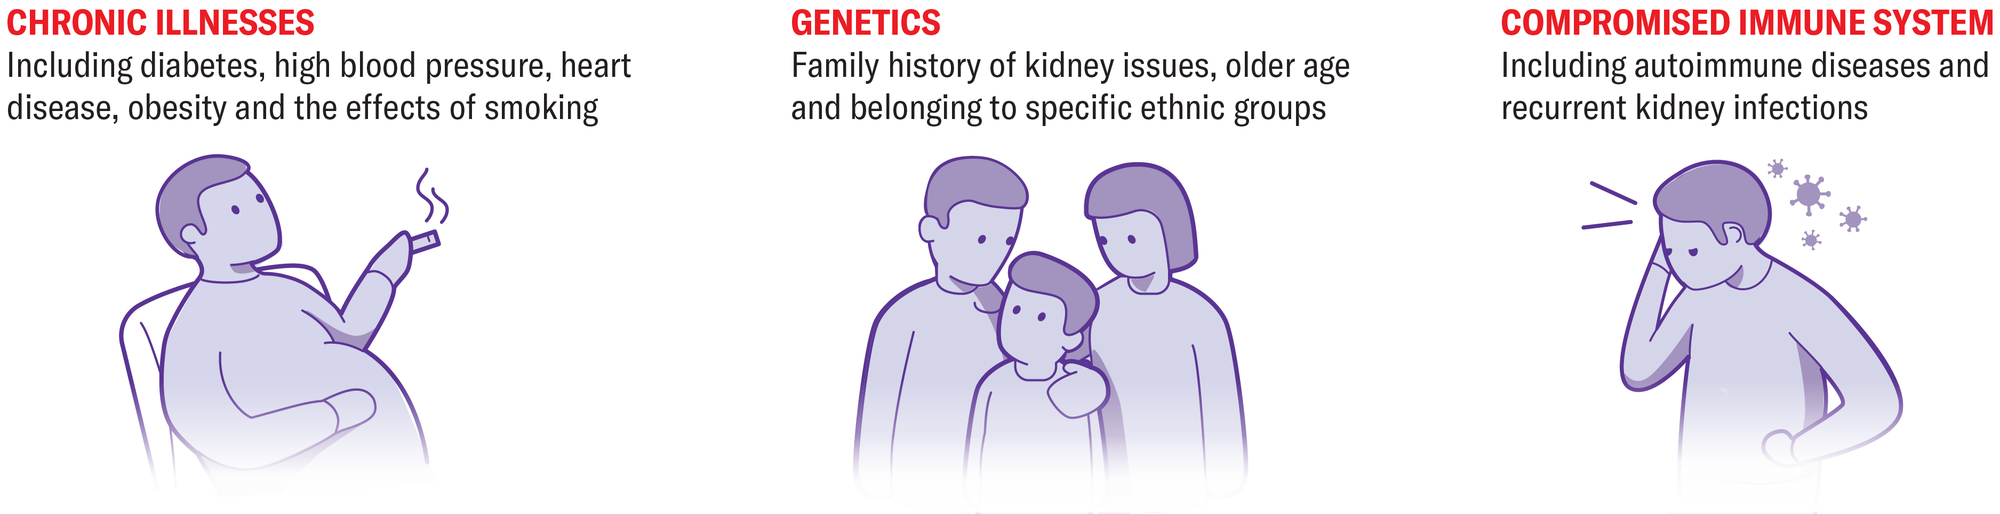
Graphic presents three CKD risk factors: chronic illness, genetics and a compromised immune system.

Where can damage occur in the kidney?

The kidneys are composed of different structures, and damage to any of them can disrupt how waste gets filtered from the blood and removed from the body. Here are some examples of where and how that damage can occur.
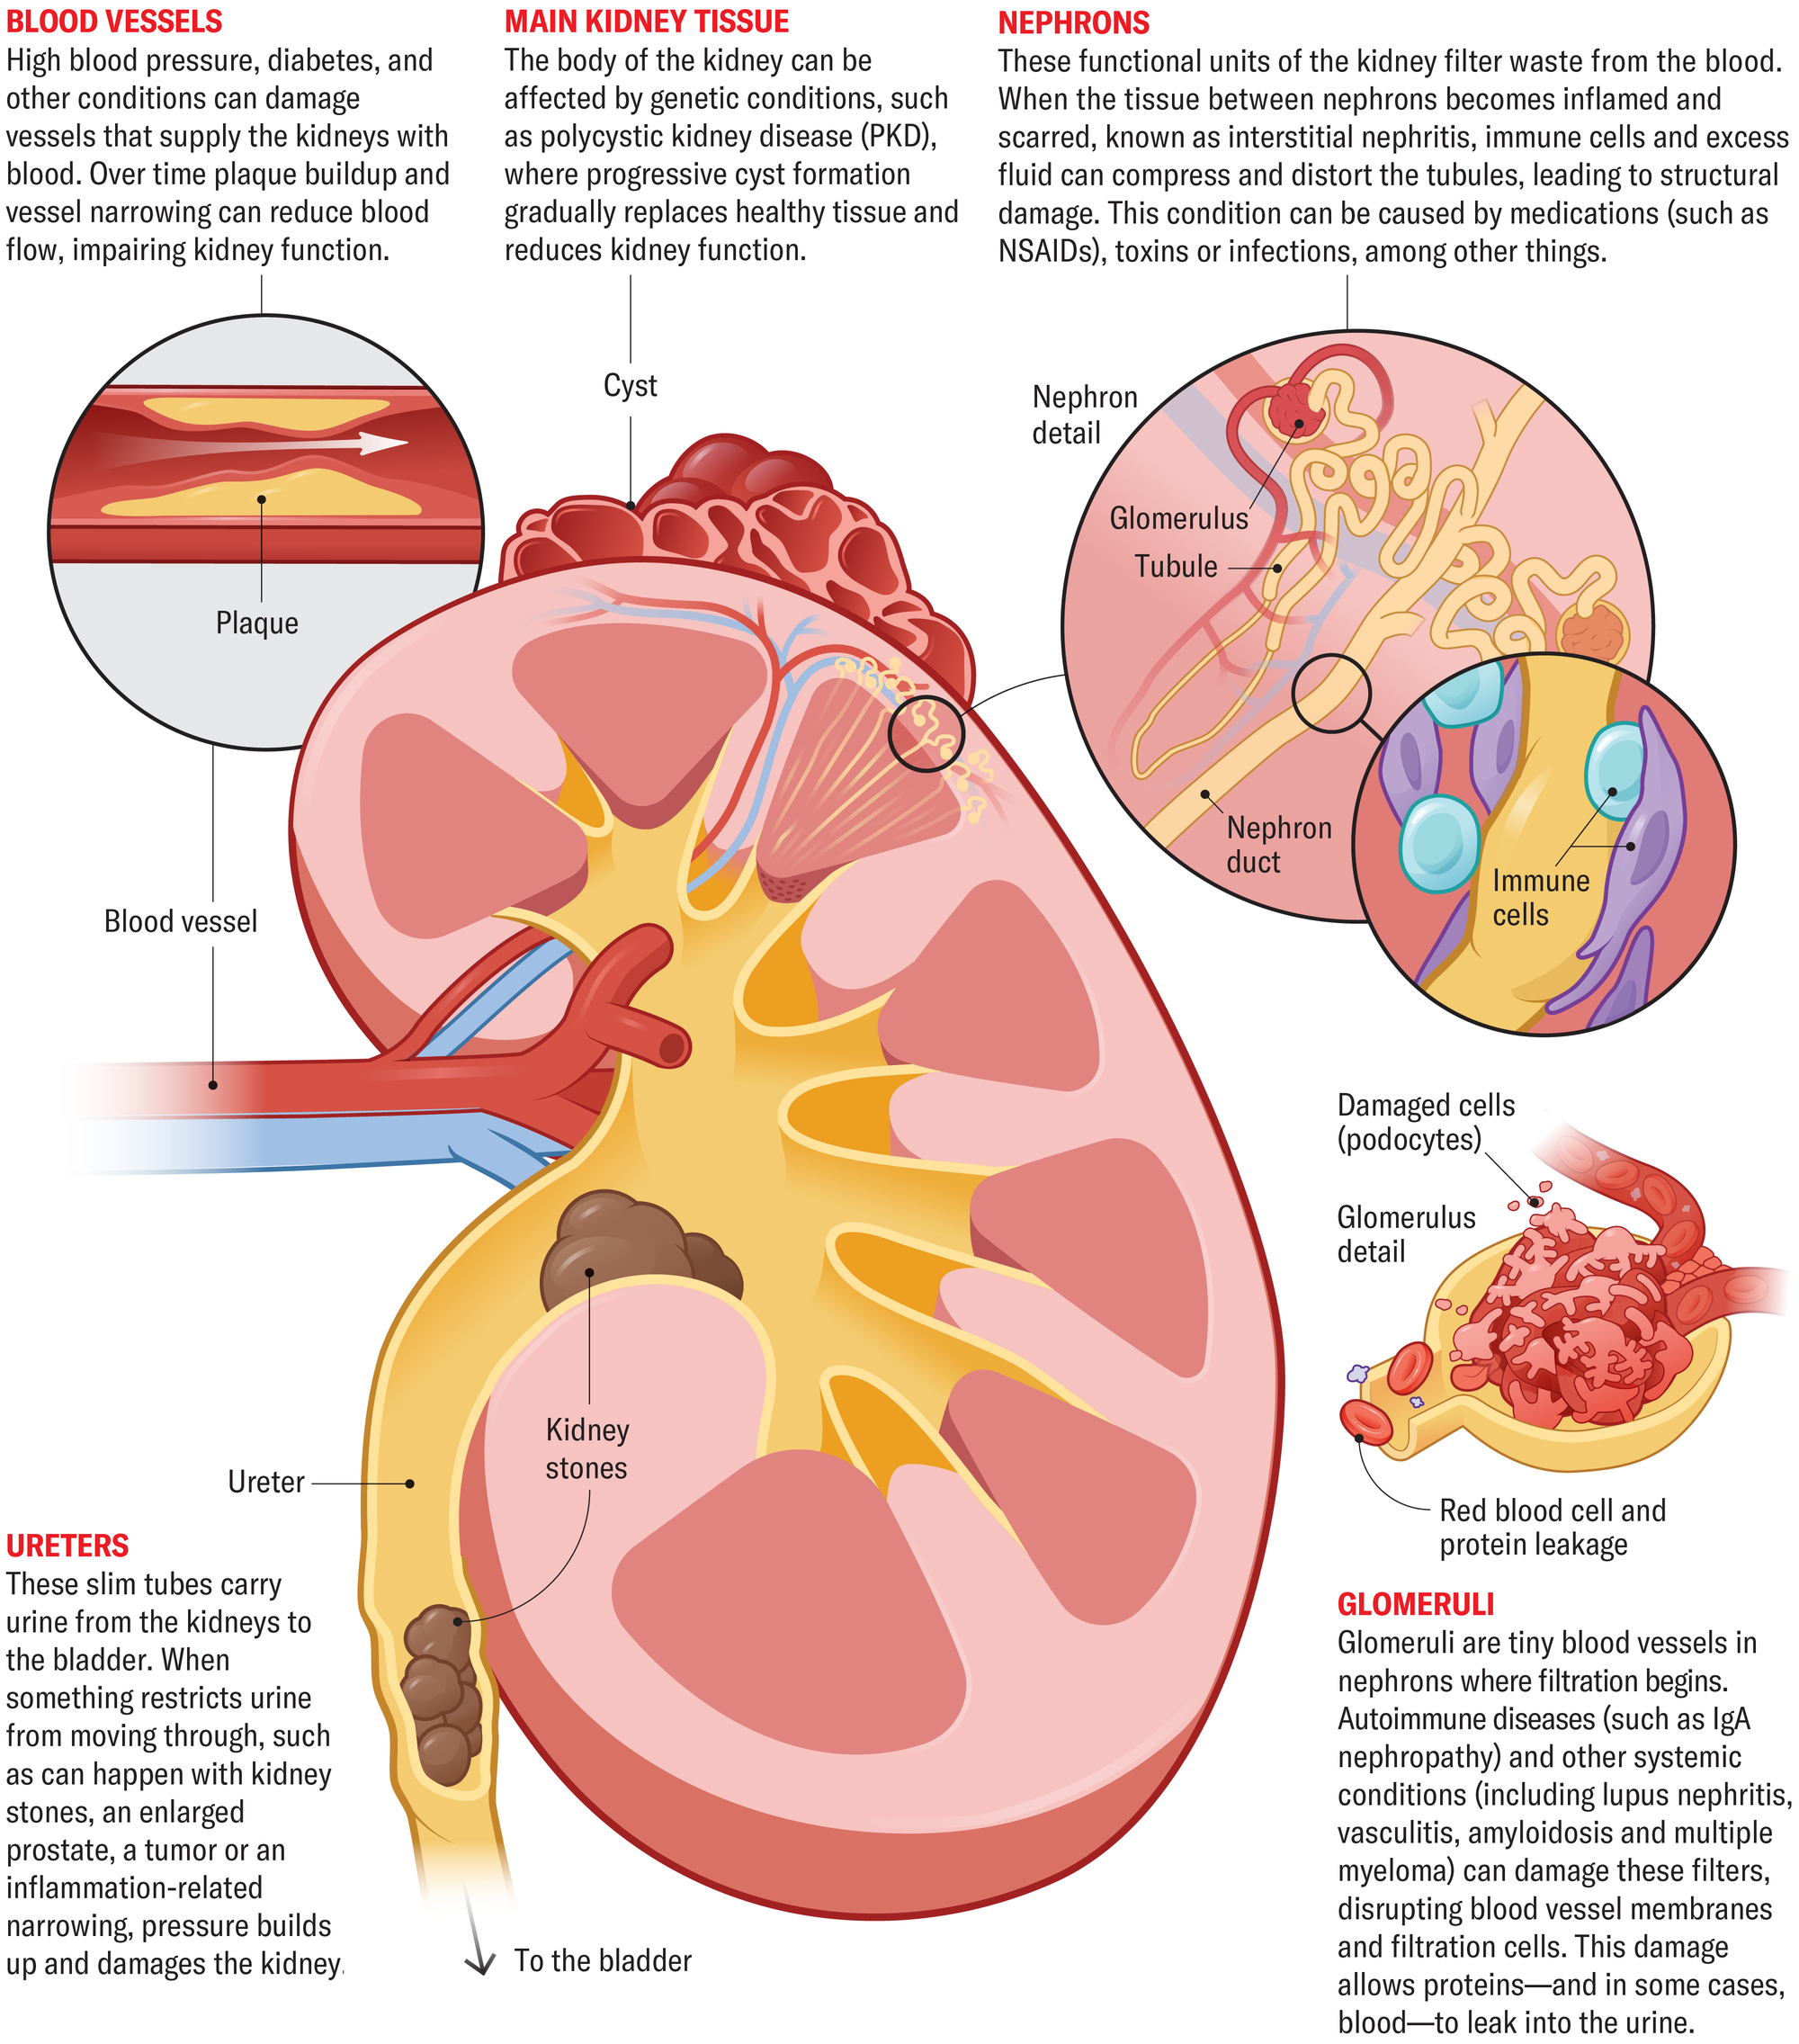
Graphic shows kidney anatomy, with five areas highlighted; blood vessels, a cyst on the main kidney tissues, nephrons, glomeruli, and kidney stones in the ureter.

Now Medical Studios

Now Medical Studios is a multidisciplinary studio that creates medical illustrations and animations for clients in the pharmaceutical and healthcare industries.

More by Now Medical Studios

Jen Christiansen is an information designer, visual science communicator and author of the book Building Science Graphics: An Illustrated Guide to Communicating Science through Diagrams and Visualizations. She began her publishing career in New York City at Scientific American, moved to Washington, D.C., to join the art department of National Geographic, spent four years as a freelance science communicator and then returned to Scientific American for a second stint, during which she became the magazine’s first graphics-specific art director. In that role, she established a consistent data visualization and diagram philosophy across all articles. She writes and presents on topics ranging from reconciling her love for art and science to her quest to learn more about the pulsar chart on Joy Division’s Unknown Pleasures album cover. Her work can be viewed at www.jenchristiansen.com

More by Jen Christiansen
Scientific American Magazine Vol 334 Issue 4This article was published with the title “The Burden Rises” in Scientific American Magazine Vol. 334 No. 4 (), p. 79
doi:10.1038/scientificamerican042026-24J2E1GSJU0sLhgJCgySjg

Subscribe to Support Independent Journalism

Great science journalism requires human expertise, time, effort and creativity. And it costs money. That’s why I and the journalists here at Scientific American hope you’ll join our community.

When you subscribe, you are supporting staff and freelance journalists who are passionate about telling science stories that are true, important and compelling. Our editors and reporters are often experts in their fields, which means they understand the nuances of big discoveries and can untangle the breakthroughs from the hype. With a subscription, you are also supporting rigorous fact-checking to ensure the words we publish are precise and accurate. And you’re supporting original illustrations, graphics and photos that bring you closer to an advanced laboratory, an ice sheet in Antarctica or a space mission in orbit. You’re helping us craft other types of high-quality journalism as well: Our newsletters are carefully written, edited and curated by staffers you have or will come to know and love. Our Science Quickly podcast is based on original reporting, collaboration with editors and scientists and exacting production.

Subscriptions keep this engine running so we can continue to deliver thoughtful, rigorous and independent science journalism to you. In an era of viral misinformation, this work is crucial. If you value what we do, I hope you’ll consider joining us as a subscriber

Thank you,

Jeanna Bryner, Editor in Chief, Scientific American

Subscribe