
This article was published in Scientific American’s former blog network and reflects the views of the author, not necessarily those of Scientific American
Maps are one of the most powerful tools humans have ever created. With a map, you can find your way around. You can organize information on all sorts of things: political affiliations, biospheres, changes in sea ice, migrations of people and animals. You can make maps that show regions changing over time, revealing history and telling stories. Geologic and topographic maps help us understand not only our world, but other worlds, too. Even the simplest maps can tell us important things about the places we're studying. They can help us see things we never would have noticed without them.
We've recently mapped two places we've never mapped quite this way before. And the results are delicious.
Our first stop is Hunga Tonga Hunga Ha'apai, a volcanic island born in January 2015, when an erupting seamount managed to breach the sea. Bits of it existed before then, but were joined together by newly-erupted material. It probably won't survive for long: lots of bits of it have already eroded away. So why bother mapping it in the first place?
On supporting science journalism
If you're enjoying this article, consider supporting our award-winning journalism by subscribing. By purchasing a subscription you are helping to ensure the future of impactful stories about the discoveries and ideas shaping our world today.
The mapping will help researchers understand how such rapidly formed volcanic islands evolve and why their survival as land is often limited. Preliminary analysis by Ferrini and NASA scientists from the Goddard Space Flight Center show why the new island has lost nearly 30 percent of its initial land area in only 15 months since the eruptive activity ended in late January 2015. The work showed that the submarine topography around the new island clearly affects the pace and location of erosion due primarily to marine abrasion and local subsidence.
The work will contribute to understanding of hydro-volcanic processes on planets such as Mars, where similar-appearing volcanic structures have been observed by NASA satellites such as the Mars Reconnaissance Orbiter.
Helping us understand processes on both Earth and Mars? Awesome! And in an age where rising sea levels become critically important, it's going to be really nice to understand the dynamics of erosion on islands and such. The more we know, the better we can adapt to our changing environments. (Of course, those of us who love knowledge for its own sake don't need such excuses. We simply enjoy learning things we didn't know before.)
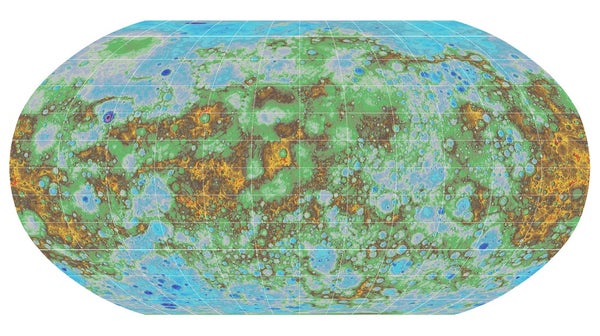
Okay, so a map of a brand-new and probably doomed volcanic island is really, really neat, but you know what's even better? The first global topographic map of Mercury!
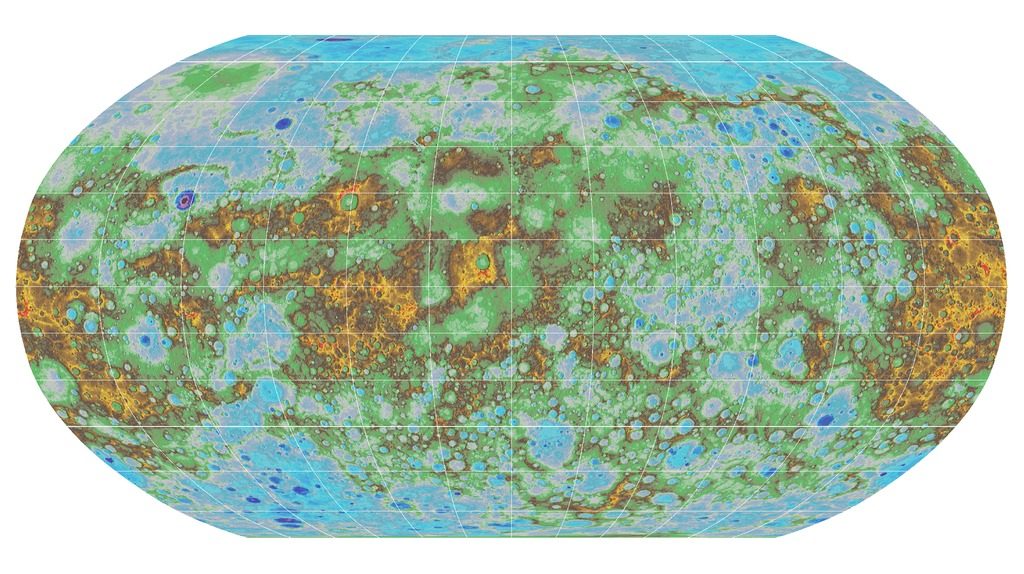
So here's what got me excited about it:
This high-resolution map provides the first comprehensive view of Mercury’s entire surface, illustrating the planet’s craters, volcanoes and tectonic landforms.
Volcanoes! Tectonic landforms! Oh, my! I can hardly wait to get me hands on papers describing how volcanism and tectonics work on Mercury. It's not just fascinating in its own right: it helps us understand our own planet's tectonics better.
Also, this is a technical breakthrough:
USGS scientists created cutting-edge, sophisticated new software applications and procedures that changed the way large amounts of images are processed for the purpose of creating topographic maps. Many of Mercury’s landforms, or features, were identified in more than 100,000 spacecraft images, and the photos were then accurately matched together to create a digital map.
Challenges arise when trying to match images taken from different spacecraft locations and ranges around the planet’s surface. As the direction to the sun changes in relation to Mercury, images will also have varying levels of brightness and shadows. This new software-based technique, developed by the USGS Astrogeology team using the Integrated Software for Imagers and Spectrometers, has greatly improved scientists’ ability to overcome these difficulties and resulted in the largest dataset ever processed in the center’s software system.
“We are eager to apply what we learned from this mapping effort to small bodies such as asteroids and comets, as well as other planets and moons,” said Kris Becker, USGS scientist and lead map investigator.
Do you want more? Do you want a rotating animation of the planet? You can have it!
When I was a kid, I had no idea we'd be seeing other worlds this way. And we're just getting started. Astrogeology is a thing, people. It is a fantastic thing, and now we have geologic maps of other planets, and I could not be more excited unless NASA came knocking and invited me to visit Mars with a rock hammer (NASA: the answer is "Yes, of course I will visit Mars with a rock hammer!" in case you're wondering.)
I cannot wait to see what our astrogeologists come up with next.