
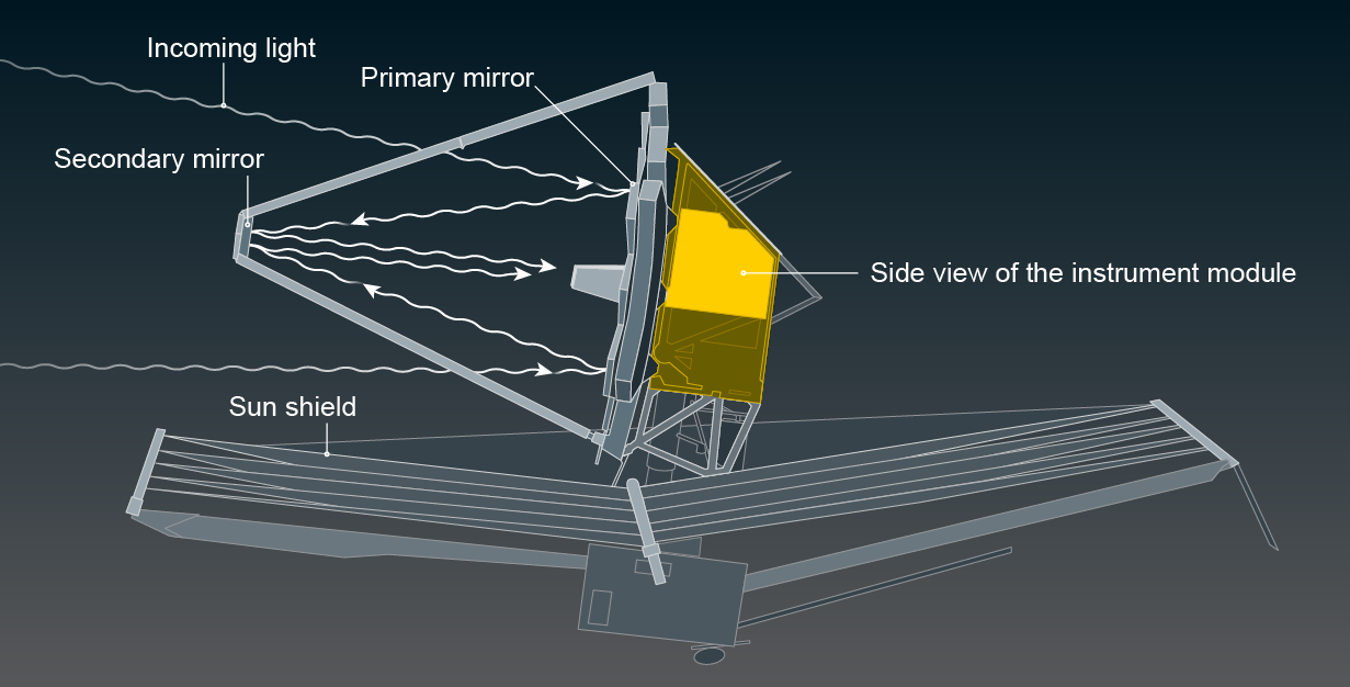
As light travels through space, it gets stretched by the expansion of the universe. This is why many of the most distant objects shine in infrared light, which is longer in wavelength than visible light. We can't see this ancient light with our eyes, but the James Webb Space Telescope (JWST) was designed to capture it, revealing some of the first galaxies ever to form.

Credit: Jen Christiansen
Integrated Science Instrument Module
On supporting science journalism
If you're enjoying this article, consider supporting our award-winning journalism by subscribing. By purchasing a subscription you are helping to ensure the future of impactful stories about the discoveries and ideas shaping our world today.
JWST’s core includes four science instruments, described below, that collect its data.
Credit: Jen Christiansen
Six Data Collection Components . . .
Aperture Masking: A perforated metal plate blocks some of the light entering the telescope, allowing it to simulate an interferometer, which combines data from multiple telescopes to achieve higher resolution than a single lens. The technique reveals more details of very bright objects close together, such as two stars nearby on the sky.
Micro Shutter Array: A grid of 248,000 small doors can open or close to measure spectra—light spread into its constituent wavelengths—from up to 100 points in a single frame.
Spectrographs: Gratings or prisms separate incoming light into spectra to reveal the intensity of individual wavelengths.
Cameras: JWST has three cameras—two that capture light in the near-infrared wavelength range and one that works in the mid-infrared.
Integral Field Unit: A combined camera and spectrograph captures an image, along with spectra for each pixel, revealing how the light varies across the field of view.
Coronagraphs: Glare from bright stars can blot out fainter light from planets and debris disks orbiting those stars. Coronagraphs are opaque circles that block that bright starlight to let the weaker signals through.

Credit: Jen Christiansen
. . . Distributed across Four Instruments
Fine Guidance Sensor (FGS)/Near-InfraRed Imager and Slitless Spectrograph (NIRISS): The FGS is a guide camera that helps to point the telescope in the right direction. It’s packaged together with the NIRISS, which has a camera and a spectrograph to take images and spectra in the near-infrared range.

Credit: Jen Christiansen (graphic); NASA; ESA; STScI; Andi James and J. Olmsted, STScI (references)
Near-Infrared Spectrograph (NIRSpec): This dedicated spectrograph can capture 100 spectra simultaneously with its micro shutter array. It’s the first space instrument capable of taking spectroscopy for so many objects at once.

Credit: Jen Christiansen (graphic); NASA; ESA; STScI; Andi James and J. Olmsted, STScI (references)
Near-Infrared Camera (NIRCam): The only near-infrared instrument with a coronagraph, NIRCam will be a key instrument for studying exoplanets whose light would otherwise be drowned out by their nearby star’s glare. It will capture high-resolution images and spectra in the near-infrared.

Credit: Jen Christiansen (graphic); NASA; ESA; STScI; Andi James and J. Olmsted, STScI (references)
Mid-Infrared Instrument (MIRI): This combination camera and spectrograph is JWST’s only instrument capable of seeing in the mid-infrared, where cooler objects such as debris disks around stars and extremely distant galaxies emit their light.

Credit: Jen Christiansen (graphic); NASA; ESA; STScI; Andi James and J. Olmsted, STScI (references)
Are the Pictures “Real”?
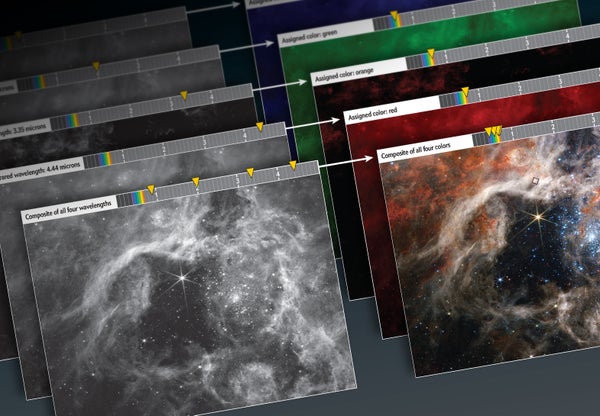
Scientists have to make adjustments to turn JWST’s raw data into something human eyes can appreciate, but its photos are “real,” says Alyssa Pagan, science visuals developer for the Space Telescope Science Institute. “Is this exactly what we’d see if we were there? The answer to that is no because our eyes are not built to see in infrared, and also the telescope is far more sensitive to light than our eyes.” In that sense, the telescope’s enhanced vision gives us a truer representation of what these cosmic objects look like than our relatively limited eyes could do. JWST can take images in up to 27 filters that capture different ranges of the infrared spectrum. Scientists first isolate the most useful dynamic range for a given image and scale the brightness values to unlock the most details. They then assign each infrared filter a color from the visible range of the spectrum—the shortest wavelengths get blue, and longer wavelengths move to green and red. After these are added together, all that’s left are the normal white balancing, contrast and color adjustments that any photographer might make.

Credit: Jen Christiansen (graphic); NASA, ESA, CSA, STScI and Webb ERO Production Team (image source)
Data Details
Although the full-color images are captivating, many of the exciting discoveries show up one wavelength at a time. Here the NIRSpec instrument reveals different features of the Tarantula Nebula via different filters. The wavelength emitted by atomic hydrogen (blue), for instance, comes from a central star as well as from a bubble surrounding it. In between are the signatures of molecular hydrogen (green) and complex hydrocarbons (red). The data suggest that a cluster of stars in the frame’s lower right is blowing a front of dust and gas toward the central star.

Credit: Jen Christiansen (graphic); NASA, ESA, CSA, STScI and Webb ERO Production Team (image source)