
This article is from Proof Positive, our friendly math newsletter that's delivered to your inbox every Tuesday afternoon. Sign up today and read it first.
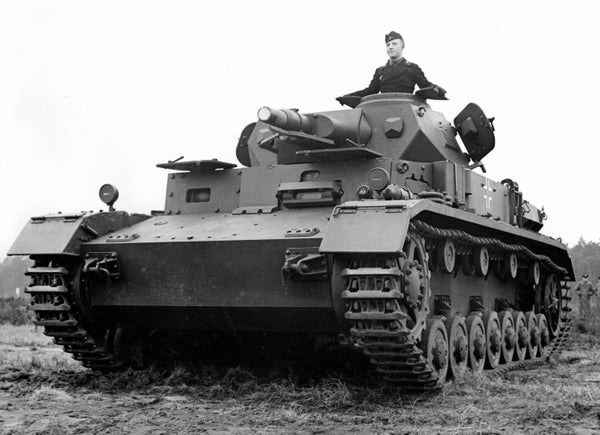
During World War II, when Allied forces—including those from the U.K., U.S. and Canada—landed on the beaches of Normandy in Operation Overlord, they took a critical step toward liberating Western Europe from Nazi control. But the planning for that maneuver was difficult. One of the challenges was that the Nazis were producing an unknown quantity of new tanks that were more powerful than older models. Intelligence agencies had to determine enemy tank production data, so they enlisted mathematicians.
On supporting science journalism
If you're enjoying this article, consider supporting our award-winning journalism by subscribing. By purchasing a subscription you are helping to ensure the future of impactful stories about the discoveries and ideas shaping our world today.
During earlier fighting, the Allies had recovered several enemy tanks. Upon examination, they discovered serial numbers on some components. Statisticians then analyzed these sequences and made a startling discovery. Although the numbers on the chassis were divided into various unrelated intervals, the transmissions appeared to be numbered sequentially, as were the tank guns, heaters, road wheels and turret engines. Using all the collected data, the experts could estimate how many new tanks the Nazis produced each month. Ultimately, the mathematical results for this so-called German tank problem were significantly closer to the truth than any other estimates.
We can walk through the math together using a simplified set of numbers. Consider the following scenario: Suppose there are N = 271 tanks, numbered sequentially from 1 to 271. For the purposes of our thought experiment, you don’t know the number N, but you have managed to recover 15 enemy tanks, marked 3, 7, 17, 80, 92, 96, 98, 116, 125, 138, 166, 167, 199, 232 and 242. You can therefore assume that there are at least 242 generic tanks. But there could be more. To estimate N, assume that the 15 tanks captured were completely at random—an arbitrary sample of 15 numbers from Npossible numbers.
Four Methods to Estimate the Number of German Tanks
You can estimate N by calculating the sample median. This is the number that lies exactly in the middle of the ordered list. The sample therefore contains as many values smaller than the median as it does values that are larger. In our example of 15 tanks, the median m’ is the eighth number, so m’ = 116. One possible estimate would be that the sample median m’ is the same as the median of the list of all N tanks.
For such an ascending list of N numbers, the median of all tanks, if N is odd, is: m = (N + 1) / 2. Therefore, we can make a first estimate of the total number, N₁, using the median m’: N₁ = 2m’ − 1 = 2 × 116 − 1 = 231. But the highest number in our sample is 242, so N must be larger.

The sample median (116) does not necessarily have to match the actual median (136).
Amanda Montañez
It might be better to consider the mean rather than the median. In a list 1, 2, 3, ..., N, the median and mean are the same, but in a sample, these two values can differ.
The sample mean (or average) is obtained in this case by summing all the numbers (1,778) and dividing by how many there are, that is, 15. In this case, the mean, M ≈ 119. Using the same formula as for the median, a second estimate, N₂, for the number of tanks can be made: N₂ = 2M − 1 = 2 × 119 − 1 = 237. Unfortunately, this value is also below 242 and therefore cannot be correct.

The sample mean (119) is slightly larger than the median (116).
Amanda Montañez
To ensure that the estimate is not smaller than the largest number in the sample, you might assume that the same number of tanks were missed at the beginning of the list as at the end. This would mean adding the number of tanks preceding the smallest sample number to the largest number. The smallest number in the sample is 3, so two tanks preceded it, and the largest number is 242. This results in a third estimate: N3 = 2 + 242 = 244.
The result would be even more accurate, however, if you considered the average intervals of the numbers in the sample. So you calculate the average distance d between each number in the sample: d = 1/15 × [(nmin − 1) + (n1 − nmin − 1) + (n2 − n1 − 1) + ... + (n13 − n12 − 1) + (nmax − n13 − 1)] = 1/15 × nmax − 1. The mean distance d, therefore, ultimately depends only on the largest number in our sample: d = 242/15 − 1 ≈ 15. This can now be added to nmax to obtain a fourth estimate: N4 = 257, which is quite close to the actual result (271).
The Allied mathematicians used precisely this method to investigate German tank production with impressive success, compared with intelligence estimates, as this table from a 1947 journal article shows:

To go a step further, you can determine which method is best for these predictions using what mathematicians call Monte Carlo simulations. You set different values of N and randomly select different samples of size n, with which the two estimates N3 and N4 are determined. By repeatedly performing the experiment with a computer, you can examine the probability distributions of N3and N4, as well as their means and variances (a measure of spread). Doing this, you will find that both means will converge toward the actual value N—though the variance of N4 is smaller than that of N3. In other words, the Allied mathematicians picked the best mathematical strategy.
This article originally appeared in Spektrum der Wissenschaft and was reproduced with permission. It was translated from the original German version with the assistance of artificial intelligence and reviewed by our editors.