
This article was published in Scientific American’s former blog network and reflects the views of the author, not necessarily those of Scientific American
A couple of weeks ago a paper about public confidence in vaccines was published in EBioMedicine. Researchers had asked some 66,000 people in 67 countries about their attitudes toward vaccines. The results were somewhat surprising, and for many who reported the story, France became an instant punch line, as its residents emerged as the least confident of all about vaccine safety. As the lead author of the study, Heidi Larson, points out, “Public trust in immunization is an increasingly important global health issue. Losses in confidence in vaccines and immunization programs can lead to vaccine reluctance and refusal, risking disease outbreaks and challenging immunization goals in high- and low-income settings.”
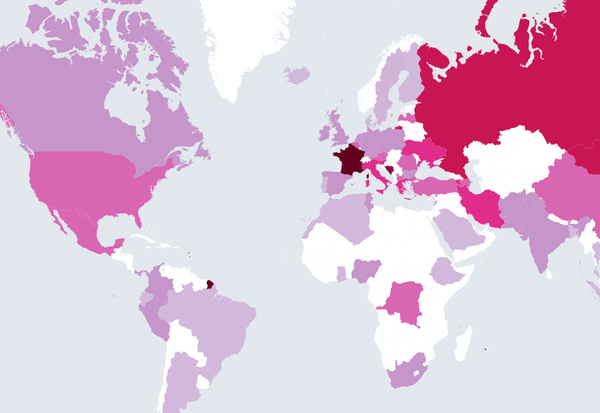
When I learned about the paper, I was intrigued, and wondered what the associated data might look like. I scanned a few news articles covering the study, expecting to see some interesting data visualizations summarizing the findings. However, the most I found was a figure from the paper including a static map, color coded by the percentage of respondents in each country who deemed vaccines unsafe. While this image was fairly informative, it seemed disproportionately focused on the topic of safety, whereas the survey also included interesting questions about vaccines’ importance, effectiveness, and compatibility with religious beliefs.
Eager to see more of the data visualized, I took matters into my own hands. After obtaining a full set of raw data from the researchers, I used the data visualization tool D3 to build the interactive graphic shown below.
On supporting science journalism
If you're enjoying this article, consider supporting our award-winning journalism by subscribing. By purchasing a subscription you are helping to ensure the future of impactful stories about the discoveries and ideas shaping our world today.
The area designated as China in these maps refers to mainland China.
Publisher’s note: Springer Nature remains neutral with regard to jurisdictional claims in published maps and institutional affiliations.
Credit: AMANDA MONTANEZ; Source: “The State of Vaccine Confidence 2016: Global insights through a 67-country survey,” by Heidi J. Larson, et al., in EBioMedicine; September 13, 2016
It’s pretty interesting to explore and compare the four maps. One peculiar conflict emerges from Southeast Asia, where the public seemingly has little doubt as to the safety, importance, or effectiveness of vaccines, yet may eschew them on religious grounds. I am also perplexed by the instances where respondents apparently deemed vaccines important for children to have, but not effective. As so often happens with data-driven graphics, the visualization not only reveals information, but also raises new questions along the way.

