
This article was published in Scientific American’s former blog network and reflects the views of the author, not necessarily those of Scientific American

Credit: Jen Christiansen
Earlier this week, astronomer Vera C. Rubin died at age 88. Rubin’s research on galaxy dynamics provided groundbreaking evidence for the existence of dark matter.
As Rubin told Discover Magazine in 1990, “Fame is fleeting…My numbers mean more to me than my name. If astronomers are still using my data years from now, that’s my greatest compliment” (from “The Woman who Spins the Stars,” by Marcia Bartusiak, in Discover, October 1990).
On supporting science journalism
If you're enjoying this article, consider supporting our award-winning journalism by subscribing. By purchasing a subscription you are helping to ensure the future of impactful stories about the discoveries and ideas shaping our world today.
In honor of Rubin, here are a few of her numbers.
First, just a bit of context, from her 1983 article on dark matter for Scientific American:

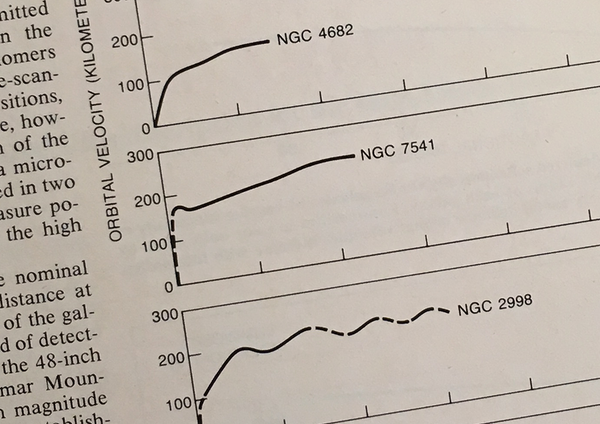
“ROTATION CURVES show orbital velocities of nine Sc galaxies from the center outward. Galaxies increase in luminosity from top to bottom. With increasing luminosity galaxies are larger, orbital velocities are higher and velocity gradients near the galactic center are steeper.” Graphic by Gabor Kiss, for “Dark Matter in Spiral Galaxies,” by Vera C. Rubin, in Scientific American, June 1983. SOURCE: “Rotational properties of 21 SC galaxies with a large range of luminosities and radii, from NGC 4605 /R = 4kpc/ to UGC 2885 /R = 122 kpc/,” by V.C. Rubin, W.K.J. Ford, and N. Thonnard, in Astrophysical Journal, Part 1, vol. 238, June 1, 1980. Credit: Jen Christiansen
“It has been known for a long time that outside the bright nucleus of a typical spiral galaxy the luminosity of the galaxy falls off rapidly with distance from the center. If luminosity were a true indicator of mass, most of the mass would be concentrated toward the center. Outside the nucleus the rotational velocity would fall off inversely as the square root of the distance, in conformity with Kepler’s law for the orbital velocity of bodies in the solar system. Instead it has been found that the rotational velocity of spiral galaxies in a diverse sample either remains constant with increasing distance from the center or rises slightly out as far as it is possible to make measurements. This unexpected result indicates that the falloff in luminous mass with distance from the center is balanced by an increase in nonluminous mass.”
“Our results, taken together with those of many other workers who have attacked the mass question in other ways, now makes it possible to say with some confidence that the distribution of light is not a valid indicator of the distribution of mass either in galaxies or in the universe at large. As much as 90 percent of the mass of the universe is evidently not radiating at any wavelength with enough intensity to be detected on the earth. Originally astronomers described the nonluminous component as “missing matter.” Today they recognize that it is not missing; it is just not visible.”
Memorable data, for sure. I also intend to remember her name.
To read more by Rubin, see “The Dynamics of the Andromeda Nebula,” in Scientific American, June 1973.