New Issue: Orbital Catastrophe Ahead? Read Now

Here’s what the autism spectrum really looks like

The autism spectrum is big, vibrant and complicated, a new graphic of 39 traits shows

Cropped image of a row of three colorful sunburst charts.

Amanda Montañez

Join Our Community of Science Lovers!

Autism is a spectrum. This metaphor is a helpful way to explain why autism looks and feels so varied across different people. Since 2013 it’s been baked into the name of the diagnosis itself, autism spectrum disorder (ASD). But what does this spectrum look like?

It’s not simply a one-dimensional scale from “more autistic” to “less autistic,” which would collapse so much of the diversity that the spectrum metaphor is meant to showcase. There is no single trait that defines autism: it encompasses differences in social communication skills, interests, sensory sensitivities, and more. Every person’s profile is unique. These graphics, based on clinicians’ evaluations of actual people using the Autism Symptom Dimensions Questionnaire, reveal a more nuanced “spectrum” of differences.

And this picture doesn’t factor in how people’s profiles change over time in response to treatments, life circumstances or age. It also doesn’t measure individuals’ overall cognitive ability, something researchers treat as a separate but important feature that can affect someone’s particular constellation of traits.


On supporting science journalism

If you're enjoying this article, consider supporting our award-winning journalism by subscribing. By purchasing a subscription you are helping to ensure the future of impactful stories about the discoveries and ideas shaping our world today.


Not all these characteristics are impairments that should be treated. “Someone not making eye contact is useful information for diagnosing autism,” but it is not necessarily an appropriate target for intervention, says Ari Ne’eman, co-founder of the Autistic Self Advocacy Network and a health policy researcher at Harvard University. Many of these traits are best thought of as normal human variation rather than something to be treated or changed, Ne’eman says.

A spectrum in many dimensions

Each of the 39 wedges in the circle represents one question in the Autism Symptom Dimensions Questionnaire. The traits associated with each question (listed below) are grouped into key symptom factors—the main aspects of behavior that evaluators look for when they assess someone for autism.
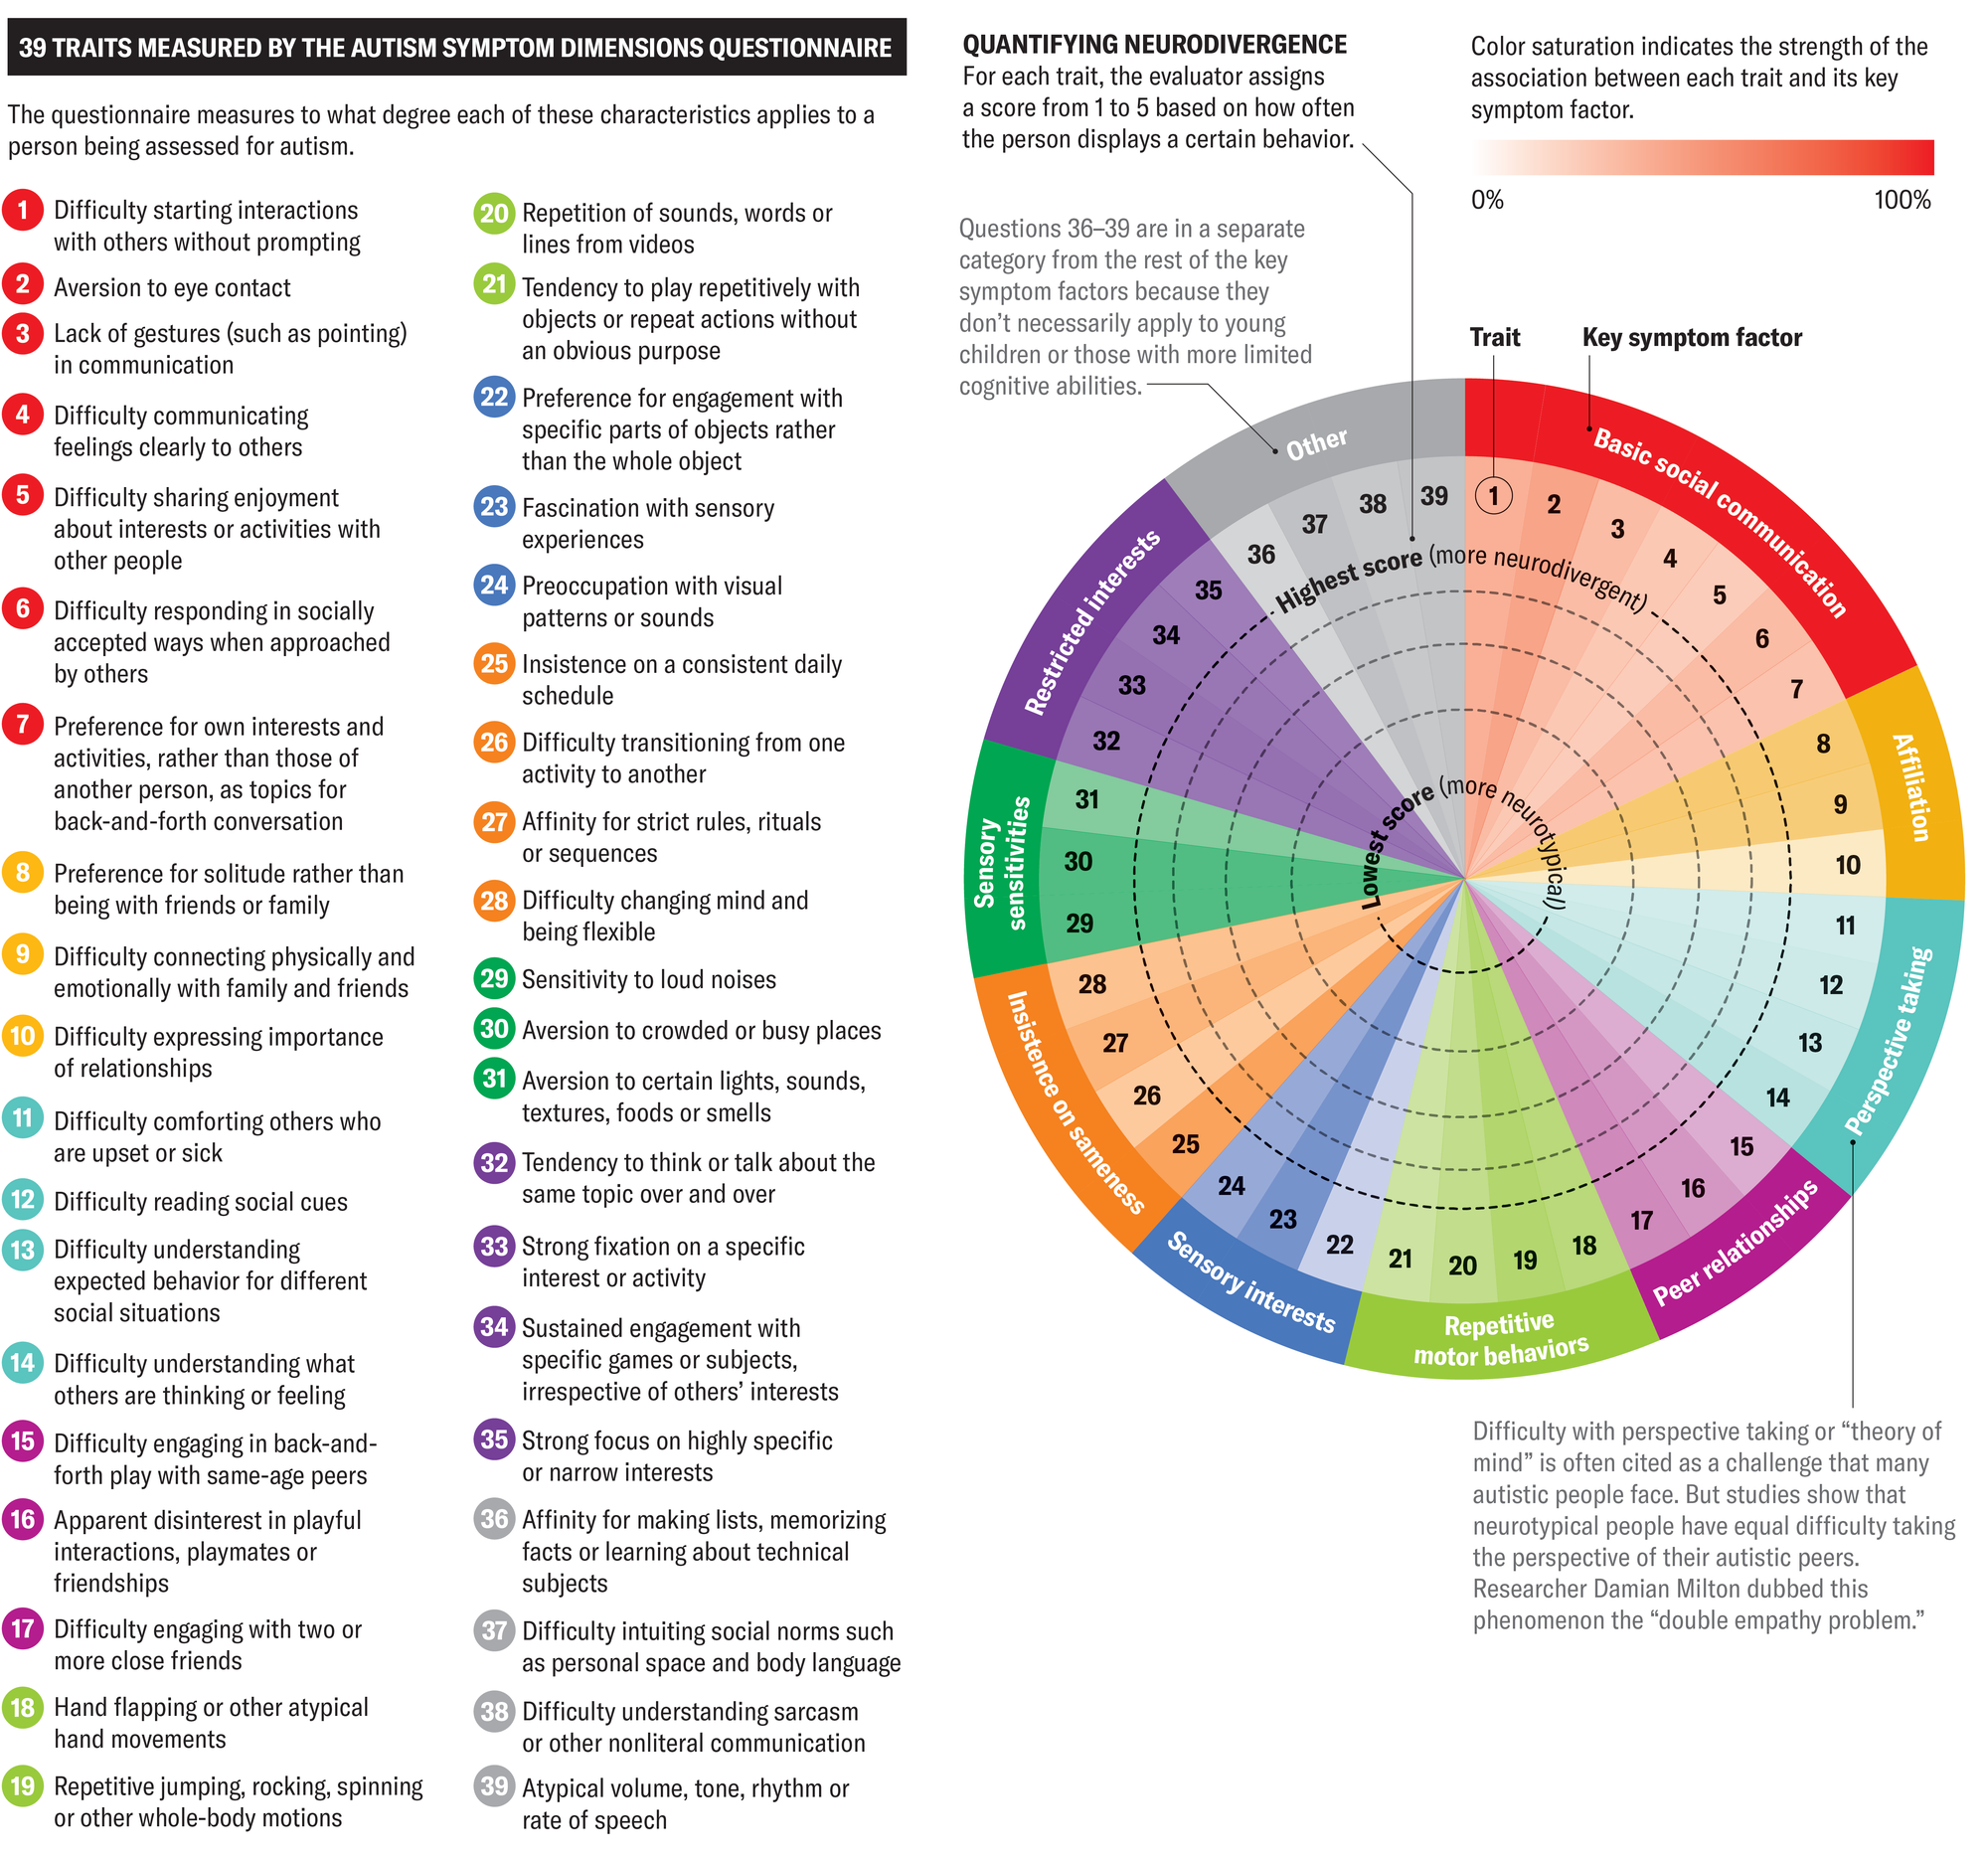
Graphic shows a chart resembling a color wheel with 29 wedges, each representing one trait from the Autism Symptom Dimensions Questionnaire. The traits are grouped by color into 10 key symptom factors including basic social communication, repetitive motor behaviors and restricted interests. Five concentric circular dotted lines represent possible scores of one to five, with five indicating a higher degree of neurodivergence. The 39 traits are listed alongside the chart.

Amanda Montañez; Source: “The Autism Symptom Dimensions Questionnaire: Development and Psychometric Evaluation of a New, Open-Source Measure of Autism Symptomatology,” by Thomas W. Frazier et al., in Developmental Medicine & Child Neurology, Vol. 65, No. 8; August 2023 (data)

Variation across individuals

These charts represent questionnaire responses for three different autistic individuals. These data reflect each person’s strengths and challenges at their current stage of development and may change over time.
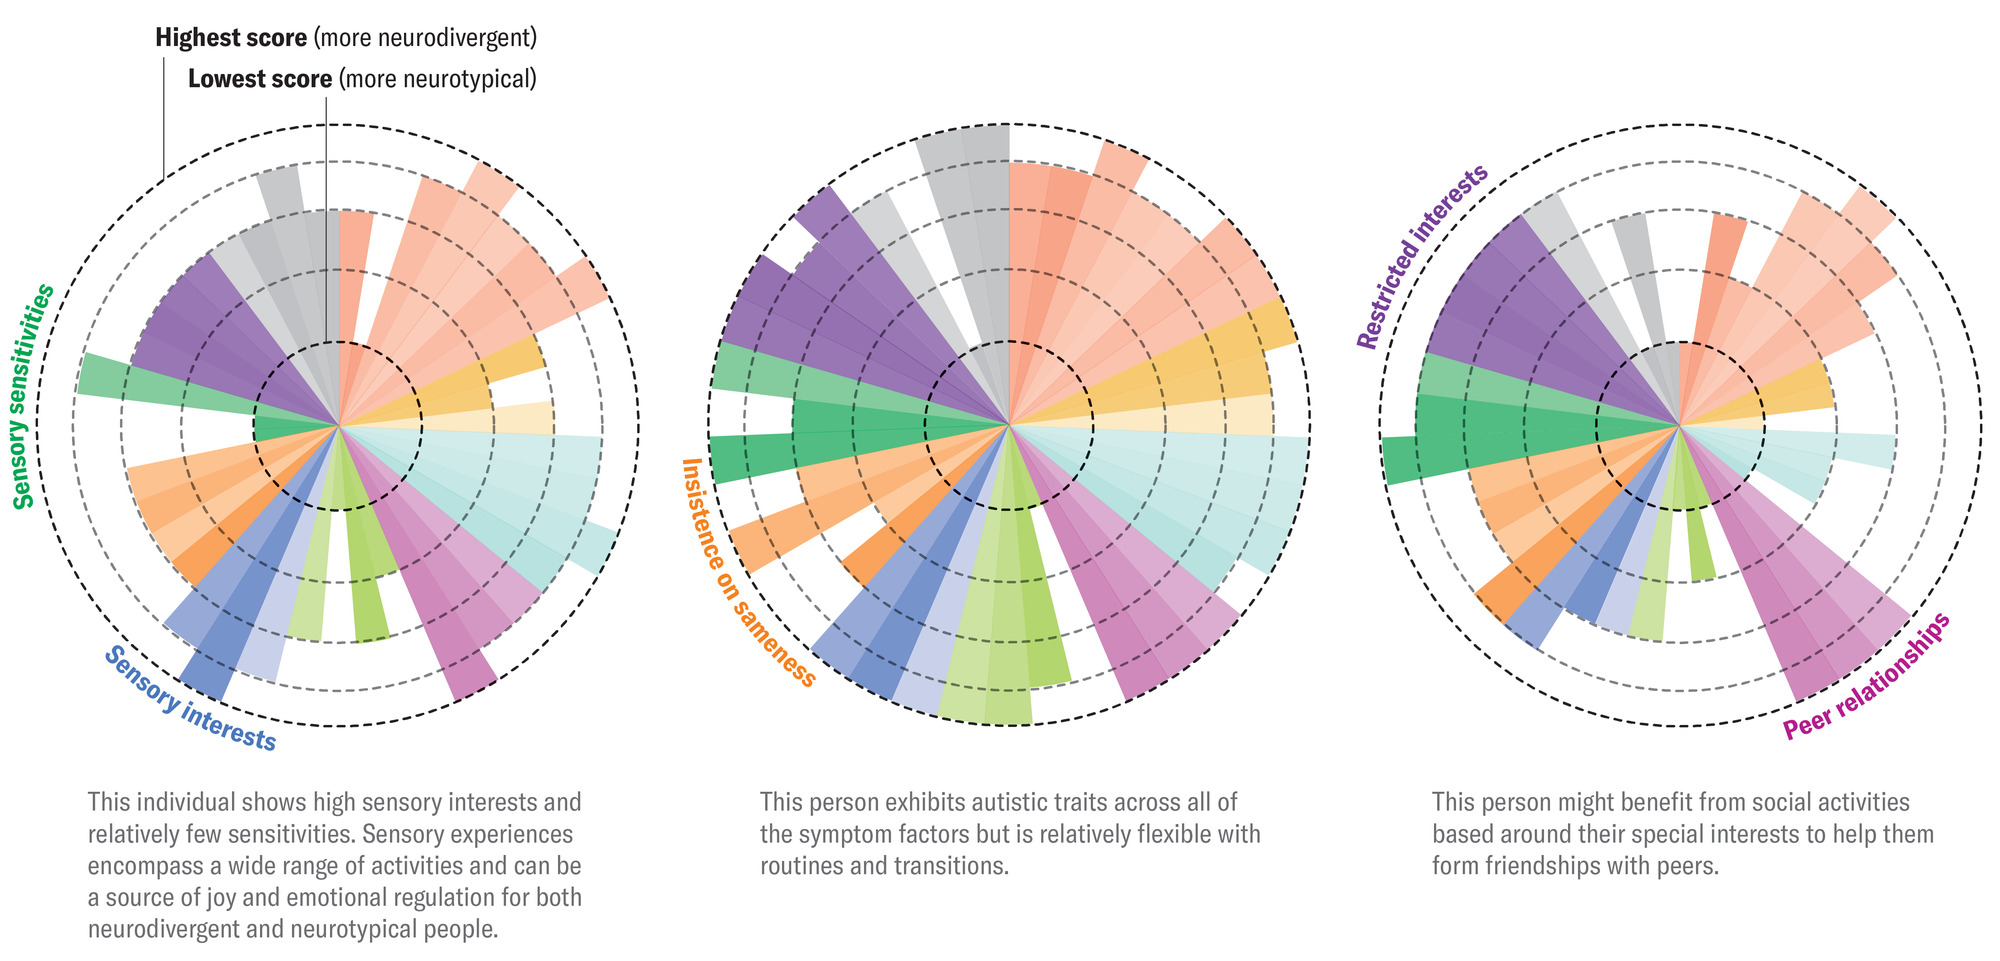
Graphic shows three circular charts modeled after the one shown in the previous graphic, each representing one autistic person’s responses to the Autism Symptom Dimensions Questionnaire. On each chart, each of the 39 wedges extends out from the center of the circle to meet the dotted line representing the person’s score for the trait associated with a specific item on the questionnaire.

Amanda Montañez; Source: “The Autism Symptom Dimensions Questionnaire: Development and Psychometric Evaluation of a New, Open-Source Measure of Autism Symptomatology,” by Thomas W. Frazier et al., in Developmental Medicine & Child Neurology, Vol. 65, No. 8; August 2023 (data)

Allison Parshall is associate editor for mind and brain at Scientific American and she writes the weekly online Science Quizzes. As a multimedia journalist, she contributes to Scientific American's podcast Science Quickly. Parshall's work has also appeared in Quanta Magazine and Inverse. She graduated from New York University's Arthur L. Carter Journalism Institute with a master's degree in science, health and environmental reporting. She has a bachelor's degree in psychology from Georgetown University.

More by Allison Parshall

Amanda Montañez is senior graphics editor and been at Scientific American since 2015. She produces and art directs information graphics for the Scientific American website and print magazine. Montañez has a bachelor's degree in studio art from Smith College and a master's in biomedical communications from the University of Toronto. Before starting in journalism, she worked as a freelance medical illustrator. Follow her on Bluesky @unamandita.bsky.social

More by Amanda Montañez
Scientific American Magazine Vol 334 Issue 4This article was published with the title “Visualizing the Spectrum” in Scientific American Magazine Vol. 334 No. 4 (), p. 74
doi:10.1038/scientificamerican042026-3vlN9IADXJkPwN6Iz8JKiW

Subscribe to Support Independent Journalism

Great science journalism requires human expertise, time, effort and creativity. And it costs money. That’s why I and the journalists here at Scientific American hope you’ll join our community.

When you subscribe, you are supporting staff and freelance journalists who are passionate about telling science stories that are true, important and compelling. Our editors and reporters are often experts in their fields, which means they understand the nuances of big discoveries and can untangle the breakthroughs from the hype. With a subscription, you are also supporting rigorous fact-checking to ensure the words we publish are precise and accurate. And you’re supporting original illustrations, graphics and photos that bring you closer to an advanced laboratory, an ice sheet in Antarctica or a space mission in orbit. You’re helping us craft other types of high-quality journalism as well: Our newsletters are carefully written, edited and curated by staffers you have or will come to know and love. Our Science Quickly podcast is based on original reporting, collaboration with editors and scientists and exacting production.

Subscriptions keep this engine running so we can continue to deliver thoughtful, rigorous and independent science journalism to you. In an era of viral misinformation, this work is crucial. If you value what we do, I hope you’ll consider joining us as a subscriber

Thank you,

Jeanna Bryner, Editor in Chief, Scientific American

Subscribe